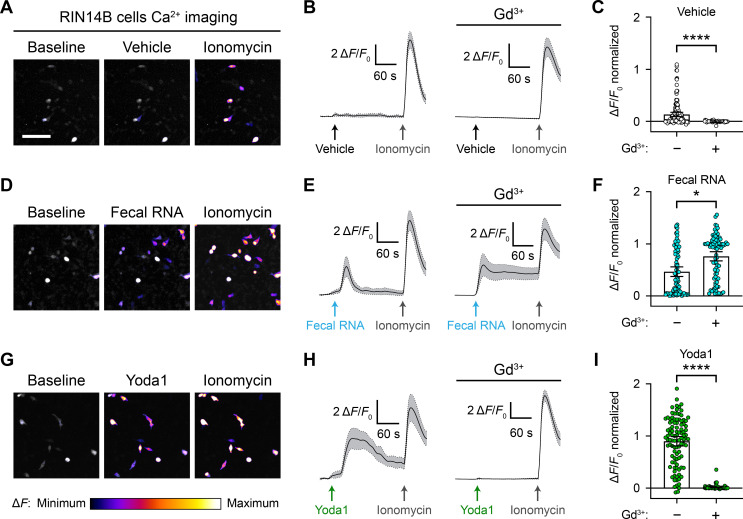
Figure 6. RNA activates RIN14B cells independently of Piezo1.
(A–C) Calcium imaging of RIN14B cell activity during application of negative control vehicle with and without gadolinium inhibition of Piezo1. Gadolinium visibly reduced spontaneous calcium transients. (D–F) RIN14B cell calcium influx in response to fecal RNA, with and without gadolinium. (G–I) RIN14B cell calcium influx in response to the positive control Piezo1 agonist Yoda1, which is blocked by gadolinium. The calcium imaging was performed on GCaMP6s-transfected cells. GCaMP6s calcium responses were measured during stimulation with 25 µg/mL fecal RNA, 15 µM Yoda1, and 10 µM ionomycin. To block Piezo1, 30 µM gadolinium was preincubated on the cells for 5 min and included throughout the calcium imaging recording. Line graphs represent mean ± 95% CI of a single recording each of n = 50 cells. Bar graphs represent n = 100–150 cells from ≥2 independent recordings for each condition, with fluorescence values normalized to the response to ionomycin = 1.0, and the bars indicate mean ± 95% CI. Pairwise comparisons between untreated and gadolinium (Gd3+)-treated recordings using Kruskal–Wallis with Dunn’s multiple-comparisons test: *p<0.05, ****p<0.0001. The scale bar for the microscope images is 100 µm.


