. 2022 Nov 24;11:e77415. doi: 10.7554/eLife.77415

Figure 3. Single ATP turnover measurements.

The turnover of mantATP by M2β 15HPZ.GFP was examined at varying KCl concentrations. The fluorescence transients from (A) WT or (B) E525K M2β 15HPZ.GFP (0.25 µM) that was pre-incubated with mantATP (1 µM) for ~30 s and then mixed with saturating unlabeled ATP (2 mM) were observed for 1000 s. The mant fluorescence transients were best fit to a two-exponential function. (C) The relative amplitude of the slow rate constants from the fluorescence transients was used to determine the fraction of heads in the super-relaxed (SRX) state. The mutant had a significantly greater SRX state fraction than WT at all KCl concentrations. (D) The slow-rate constants (SRX state) were 5–10 times slower than the fast-rate constants (disordered relaxed [DRX] state), and relatively similar (~within twofold) at each KCl concentration for both the WT and E525K constructs. Error bars are ± SD, N=3 separate protein preparations with one technical replicate per prep (*p<0.005, comparing WT and E525K, unpaired Student’s t-test). See Table 2 for summary of values.

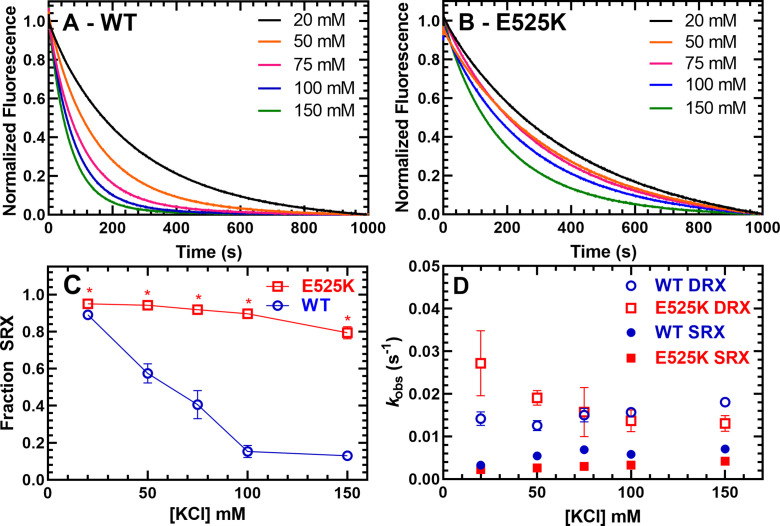
Figure 3—source data 1. Excel files with data from Figure 3.

Figure 3.

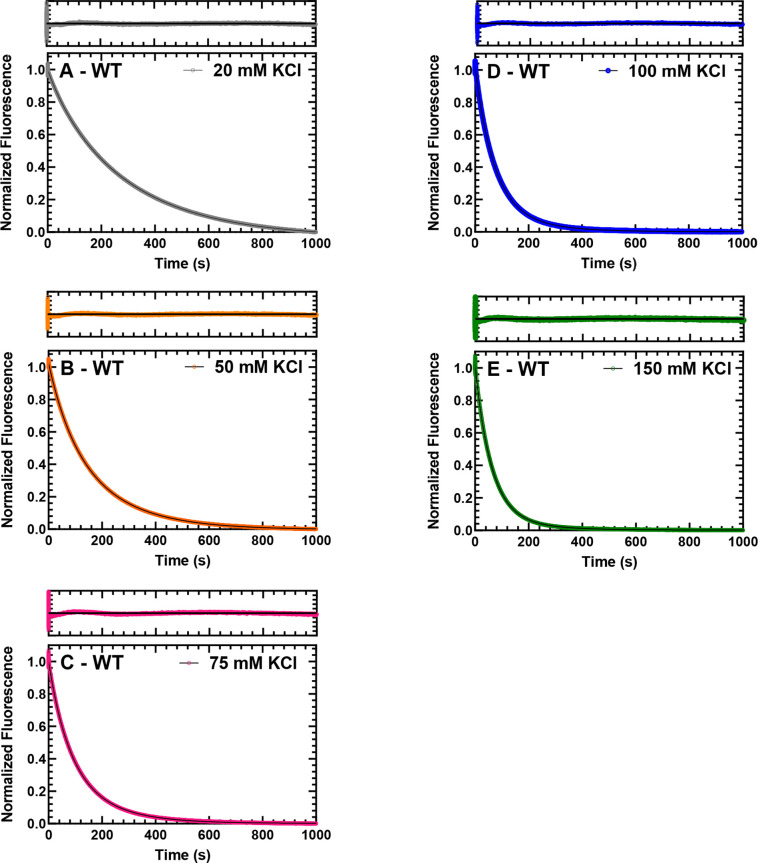
Figure 3—figure supplement 1. Single turnover with WT M2β 15HPZ.

Figure 3—figure supplement 1.

GFP. Representative data from single mantATP turnover measurements that are presented in Figure 3A of the main text. The fluorescence transients and the fit of the transients to a two-exponential function at 20, 50, 75, 100, and 150 mM KCl are shown for WT M2β 15HPZ.GFP in panels A, B, C, D, and E, respectively. The residuals are shown above each plot.
Figure 3—figure supplement 1—source data 1. Excel files with data from Figure 3—figure supplement 1.
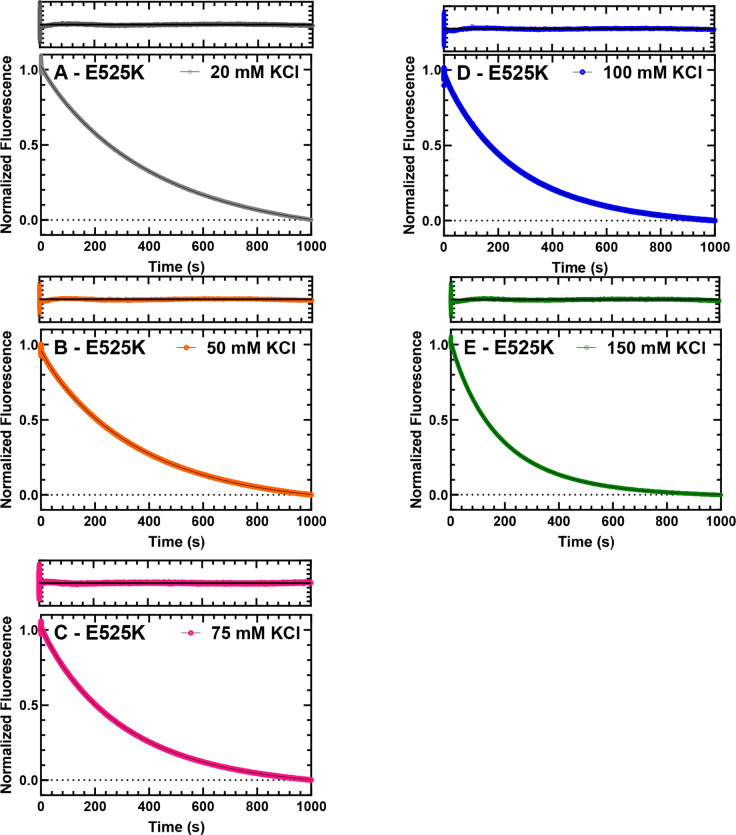
Figure 3—figure supplement 2. Single turnover with E525K M2β 15HPZ.

Figure 3—figure supplement 2.

GFP. Representative data from single mantATP turnover measurements that are presented in Figure 3B of the main text. The fluorescence transients and the fit of the transients to a two-exponential function at 20, 50, 75, 100, and 150 mM KCl are shown for E525K M2β 15HPZ.GFP in panels A, B, C, D, and E, respectively. The residuals are shown above each plot.
Figure 3—figure supplement 2—source data 1. Excel files with data from Figure 3—figure supplement 2.
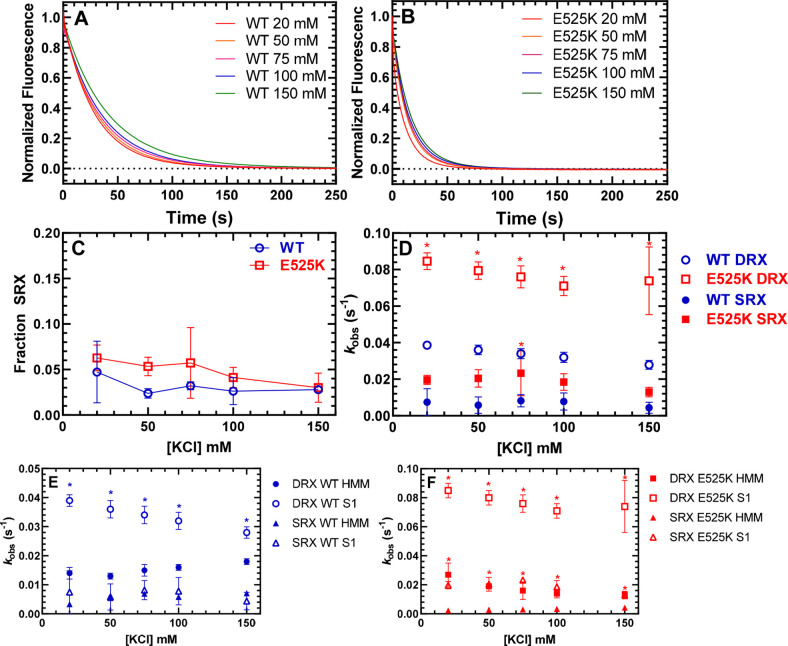
Figure 3—figure supplement 3. Single ATP turnover measurements with M2β S1.

Figure 3—figure supplement 3.

The turnover of mantATP by M2β S1 WT (A) or E525K (B) was examined at varying KCl concentrations as in Figure 3. The mant fluorescence transients were best fit to a three-exponential function. There was a minor very fast phase (~5% of the signal), which can be attributed to a small amount of mantADP release from S1 (2–4 s–1) and therefore was not included in the analysis of the other two rate constants. (C) The relative amplitude of the slow-rate constant was used to determine the fraction of heads in the super-relaxed (SRX) state. (D) The slow rate constant (SRX state) was mostly similar in WT S1 and E525K S1 while the predominant rate constant (disordered relaxed [DRX] state), which dominated the fluorescence transients (90–95% of the signal), was significantly higher in E525K compared to WT. (E) The DRX state rate constants were faster in WT S1 compared to WT heavy meromyosin (HMM), while the SRX state rate constant was similar. (F) Both the DRX and the SRX rate constants were significantly faster in E525K S1 compared to E525K HMM. All rate constants were relatively insensitive to KCl concentration (see Tables 2 and 3 for summary of values; *p<0.005, unpaired Student’s t-test).
Figure 3—figure supplement 3—source data 1. Excel files with data from Figure 3—figure supplement 3.