. 2022 Nov 24;11:e77415. doi: 10.7554/eLife.77415

Figure 4. Cy3ATP binding to M2β 15HPZ.GFP monitored by FRET.

GFP fluorescence (0.25 µM; donor) quenching was examined upon Cy3ATP (1 µM; acceptor) binding to WT (A) or E525K (B) M2β 15HPZ.GFP. The fluorescence transients were best fit to a double-exponential function at low salt (20 mM KCl) and a single or double exponential function at high salt (150 mM KCl; fast phase was 65% and 25% of the signal at low salt in WT and E525K, respectively). Residuals are shown above each plot. The total amplitude of the fluorescence change was plotted as a function of Cy3ATP concentration in WT (C) and E525K (D). All rate constants were linearly dependent on Cy3ATP concentration in both WT (E) and E525K (F) M2β 15HPZ.GFP (see Table 4 for summary of linear fits in panel E and F). Each data point in C–F represents 2–3 replicates from a single preparation of myosin, and errors bars indicate ± SE of the fit.

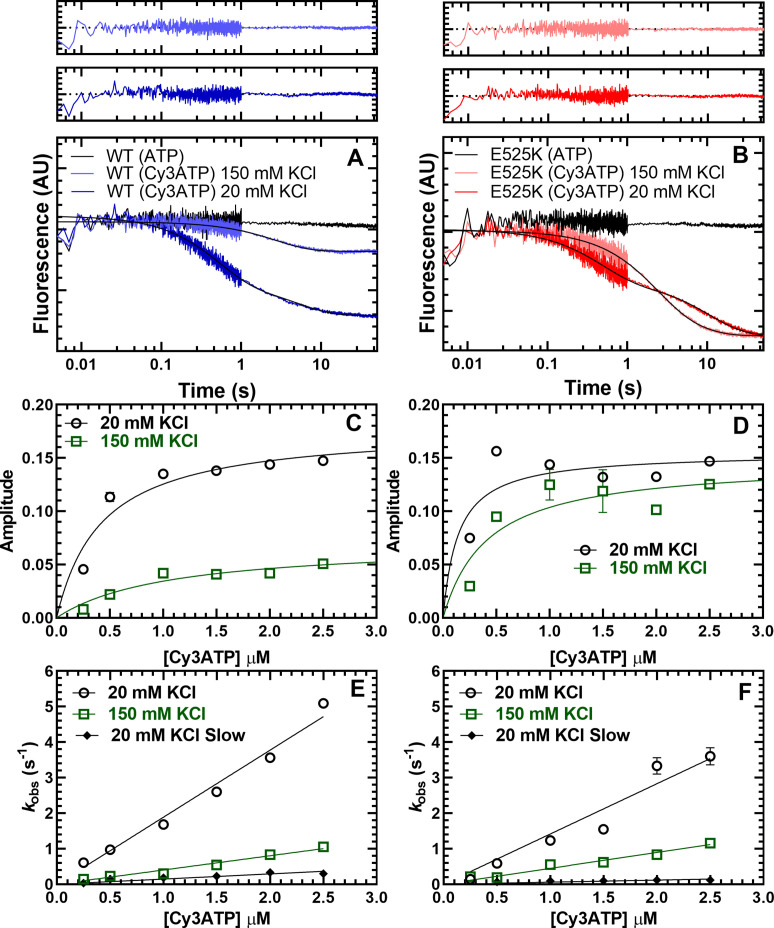
Figure 4—source data 1. Excel files with data from Figure 4.

Figure 4.

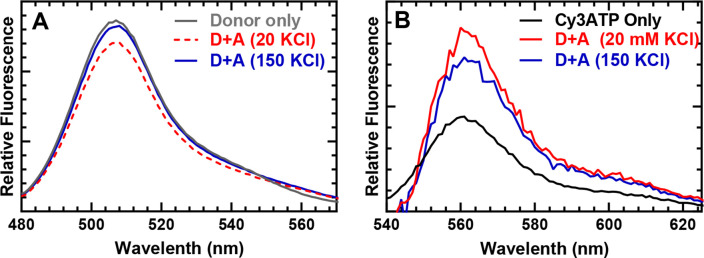
Figure 4—figure supplement 1. Steady-state FRET spectra.

Figure 4—figure supplement 1.

Fluorescence emission spectra of WT M2β–15HPZ.GFP in the presence and absence of acceptor (Cy3ATP) were examined by exciting the sample at 470 nm and measuring the emission from 480 to 625 nm. (A) Fluorescence spectra of the donor highlight the donor quenching in the presence of Cy3ATP which was reduced at higher salt. (B) Fluorescence spectra of the acceptor, after subtracting donor fluorescence, highlight the acceptor enhancement in low- and high-salt conditions. Cy3ATP alone (absence of myosin) is shown for comparison.
Figure 4—figure supplement 1—source data 1. Excel files with data from Figure 4—figure supplement 1.
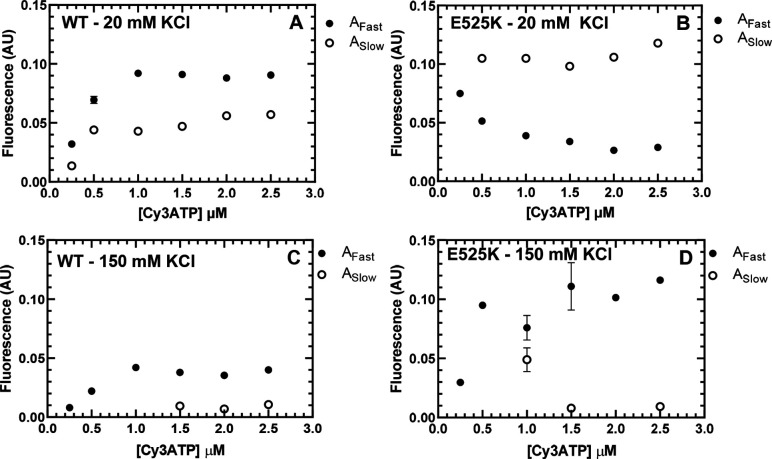
Figure 4—figure supplement 2. Amplitudes for Cy3ATP binding to M2β 15HPZ.

Figure 4—figure supplement 2.

GFP. The amplitudes of the fast and slow components of the FRET transients examined in 20 mM (A and B) and 150 mM (C and D) KCl were plot as a function of Cy3ATP concentration (see Figure 4). Each data point represents a fluorescence transient (average of 2–3 replicates) that was fit to either a single or double exponential function (see source date for fit parameters). Error bars represent ± SEM.
Figure 4—figure supplement 2—source data 1. Excel files with data from Figure 4—figure supplement 2.
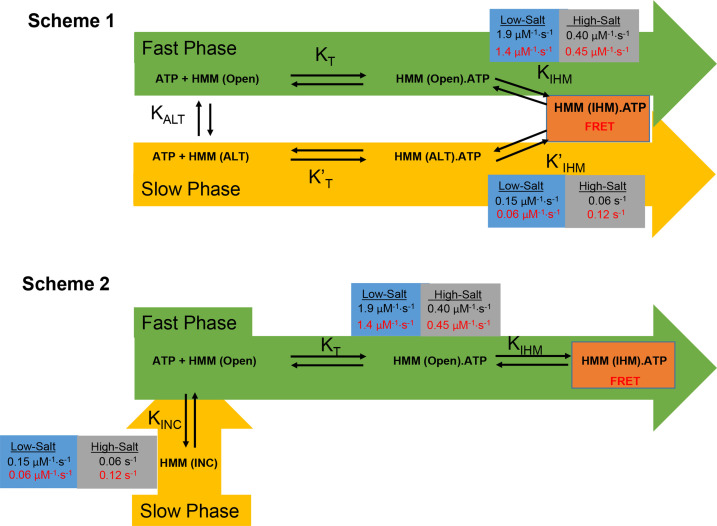
Figure 4—figure supplement 3. Kinetic models of interacting-heads motif (IHM) formation based on stopped-flow FRET.

Figure 4—figure supplement 3.

Two kinetic schemes (Scheme 1 and 2) were considered for modeling the kinetics of IHM formation. In Scheme 1, we assumed the initial ATP-binding step (KT) was followed by transition into the IHM (KIHM) which was then detected by FRET. The model postulates that heavy meromyosin (HMM) can populate two conformations in the absence of nucleotide (Apo), one that is in the Open conformation and another in an Alternate (ALT) conformation. The top pathway (Fast Phase-green) represents ATP binding to the Open state followed by a favorable transition into the IHM in low salt. The lower pathway (Slow Phase-yellow) is only significantly populated at low salt and characterized by slower ATP binding to the ALT conformation and a favorable transition into the IHM. In Scheme 2, the slow phase is caused by a conformation that is incompetent to bind nucleotide (INC) and in equilibrium with the Open conformation. In both models, in the absence of nucleotide (Apo) in low-salt conditions, the E525K mutant favors the ALT or INC conformation, while WT favors the open conformation. Also, both models predict that in high-salt conditions, the rate of transition into the IHM slows for both WT and mutant, and it is unfavorable for WT but E525K still favors the IHM. Rate constants for WT are in black and E525K in red (see Table 4 for summary of rate constants).
Figure 4—figure supplement 3—source data 1. Excel files with data from Figure 4—figure supplement 3.
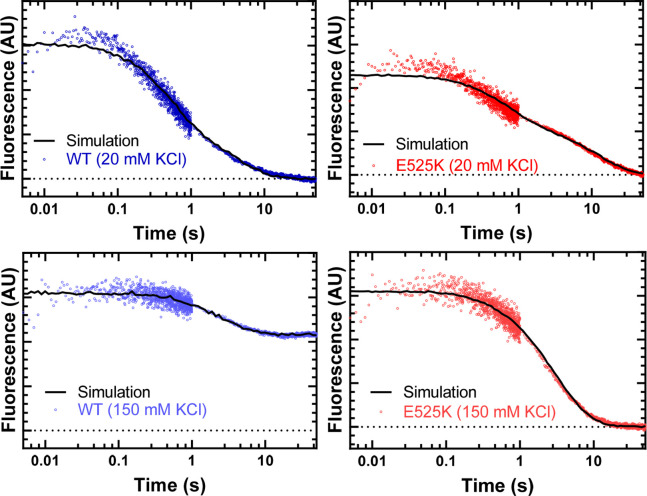
Figure 4—figure supplement 4. FRET transients fit to the proposed kinetic model.

Figure 4—figure supplement 4.

The fluorescence transients from the FRET experiments are fit to the kinetic model described in Figure 4—figure supplement 3. The values of the rate and equilibrium constants are described in the legend of Figure 4—figure supplement 3. The ATP-binding rates determined from the linear fit of the rate constants as a function of Cy3ATP concentration were held constant (k+T and k’+T µM–1∙s–1) (see Table 4) and the rate and equilibrium constants for the transition into the interacting-heads motif (IHM) (KIHM and K’IHM) we allowed to float to best fit the transients. We conclude that under the conditions of the experiments, the FRET was limited by the rate of ATP binding, and thus, the transition into the IHM was ≥5 s–1.
Figure 4—figure supplement 4—source data 1. Excel files with data from Figure 4—figure supplement 4.