. 2022 Sep 13;11:e78717. doi: 10.7554/eLife.78717

Figure 1. Illustration of internal consistency for skin conductance responses (SCRs) at T0 (A) and T1 (B) as well as ICCabs and ICCcon for SCRs (C, D) and fear ratings (E, F) color coded for stimulus type.

Internal consistency indicates the reliability of responses within each time point, while intraclass correlation coefficients (ICCs) indicate the reliability across both time points. Note that assessment of internal consistency was not possible for fear ratings as only two ratings (pre, post) were available. Error bars represent 95% confidence intervals and indicate significance, when zero is not included in the interval. The y-axis comprises the different phases or phase operationalizations. In the literature, internal consistency is often interpreted using benchmarks (Kline, 2013) for unacceptable (<0.5), poor (>0.5 but <0.6), questionable (>0.6 but <0.7), acceptable (>0.7 but <0.8), good (>0.8 but <0.9), and excellent (≥0.9). Common benchmarks in the literature for ICCs are poor (<0.5), moderate (>0.5 but <0.75), good (>0.75 but <0.9), and excellent (≥0.9) (Koo and Li, 2016). These benchmarks are included here to provide a frame of reference but we point out that these benchmarks are arbitrary and most importantly derived from psychometric work on trait self-report measures and should hence not be overinterpreted in the context of responding in experimental paradigms which bear more sources of noise (Parsons, 2020). ACQ = acquisition training, EXT = extinction training, RI = reinstatement, RI-Test = reinstatement-test, pre = prior to the experimental phase, post = subsequent to the experimental phase.

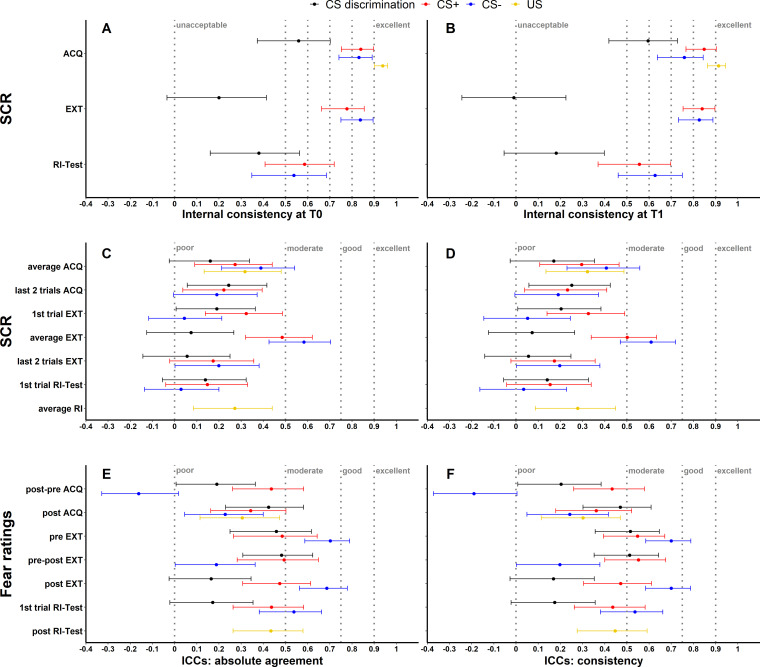
Figure 1.

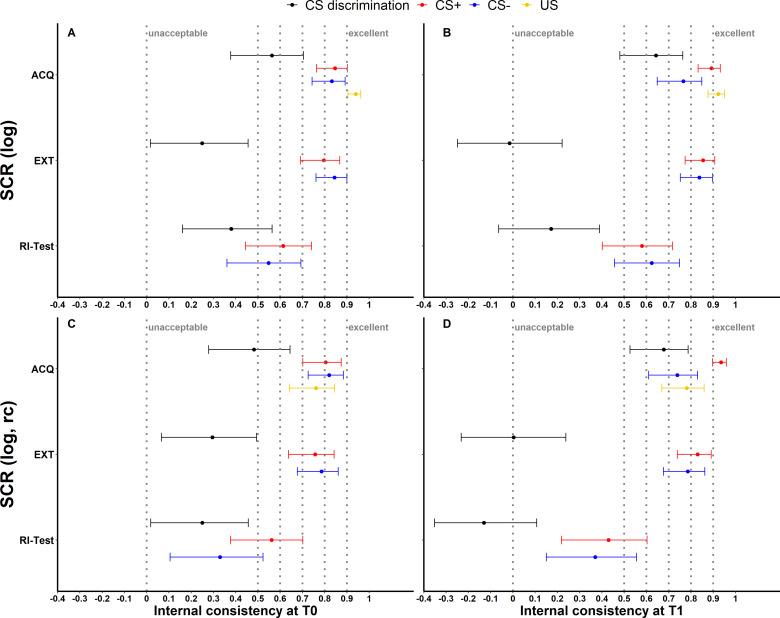
Figure 1—figure supplement 1. Illustration of (A, B) internal consistency for log-transformed (log) as well as (C, D) log-transformed and range corrected (log rc) skin conductance responses (SCRs) at T0 and T1 color coded for stimulus type.

Figure 1—figure supplement 1.

Error bars represent 95% confidence intervals and indicate significance, when zero is not included in the interval. The y-axis comprises the different experimental phases. Internal consistency is interpreted using benchmarks (Kline, 2013) for unacceptable (<0.5), poor (>0.5 but <0.6), questionable (>0.6 but <0.7), acceptable (>0.7 but <0.8), good (>0.8 but <0.9), and excellent (≥0.9). ACQ = acquisition training, EXT = extinction training, RI-Test = reinstatement-test.
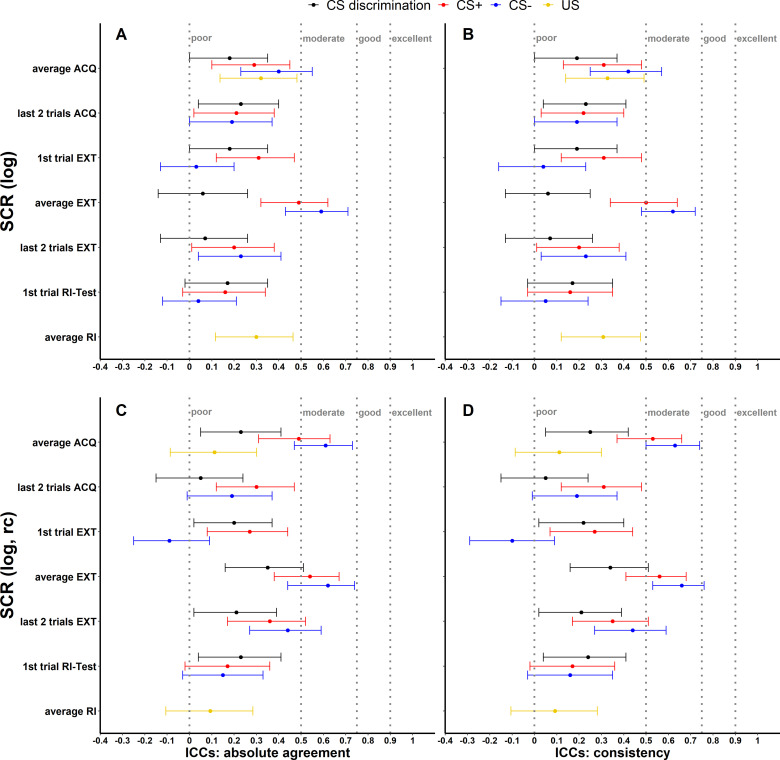
Figure 1—figure supplement 2. Illustration of (A, B) intraclass correlation coefficients (ICCs) of log-transformed (log) as well as (C, D) log-transformed and range corrected (log, rc) skin conductance responses (SCRs) color coded for stimulus type.

Figure 1—figure supplement 2.

The y-axis comprises the different phase operationalizations. A and C display ICCabs, B and D display ICCcon. ICCs <0.5, <0.75, <0.9, and >0.9 were interpreted as poor, moderate, good, and excellent, respectively (Koo and Li, 2016). Error bars represent 95% confidence intervals and indicate significance of ICCs, when zero is not included in the interval. ACQ = acquisition training, EXT = extinction training, RI = reinstatement, RI-Test = reinstatement-test.
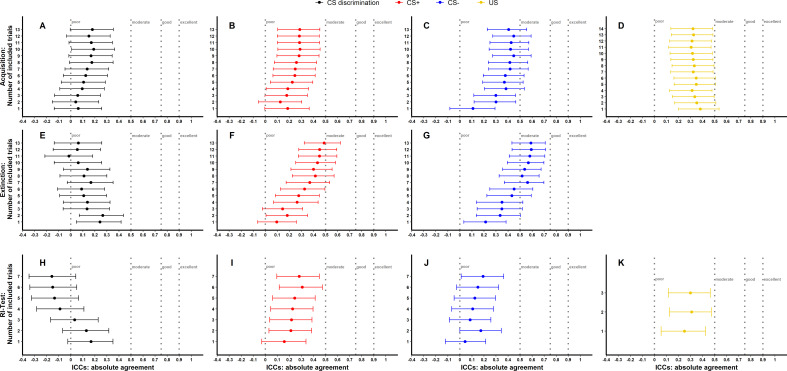
Figure 1—figure supplement 3. Illustration of ICCabs of trial-by-trial raw skin conductance responses (SCRs) for phases (A–D: Acquisition, E–G: Extinction, H–J: Reinstatement-Test, K: Reinstatement) and stimulus types separately.

Figure 1—figure supplement 3.

Trials were averaged starting with the first (i.e., reinstatement-test and unconditioned stimulus [US] trials) or second trial (i.e., acquisition and extinction training). All preceding trials were added trial-by-trial and averaged. Intraclass correlation coefficients (ICCs) <0.5, <0.75, <0.9, and >0.9 (Koo and Li, 2016) were interpreted as poor, moderate, good, and excellent, respectively. Error bars represent 95% confidence intervals. Non-overlapping error bars indicate significant differences between ICCs within one figure. RI-Test = reinstatement-test.
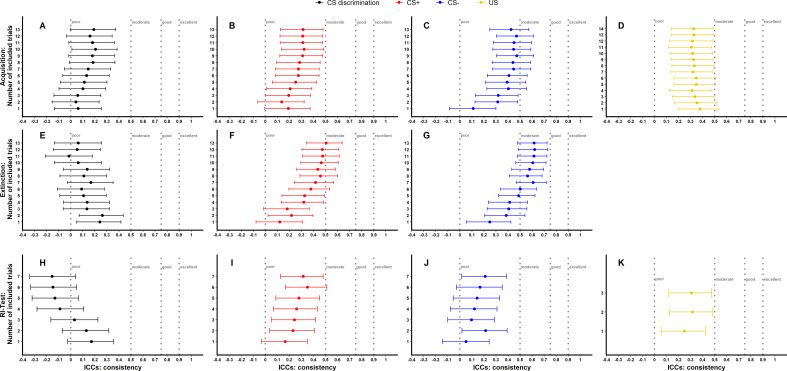
Figure 1—figure supplement 4. Illustration of ICCcon of trial-by-trial raw skin conductance responses (SCRs) for phases (A–D: Acquisition, E–G: Extinction, H–J: Reinstatement-Test, K: Reinstatement) and stimulus types separately.

Figure 1—figure supplement 4.

Trials were averaged starting with the first (i.e., reinstatement-test and unconditioned stimulus [US] trials) or second trial (i.e., acquisition and extinction training). All preceding trials were added trial-by-trial and averaged. Intraclass correlation coefficients (ICCs) <0.5, <0.75, <0.9, and >0.9 (Koo and Li, 2016) were interpreted as poor, moderate, good, and excellent, respectively. Error bars represent 95% confidence intervals. Non-overlapping error bars indicate significant differences between ICCs within one figure. RI-Test = reinstatement-test.
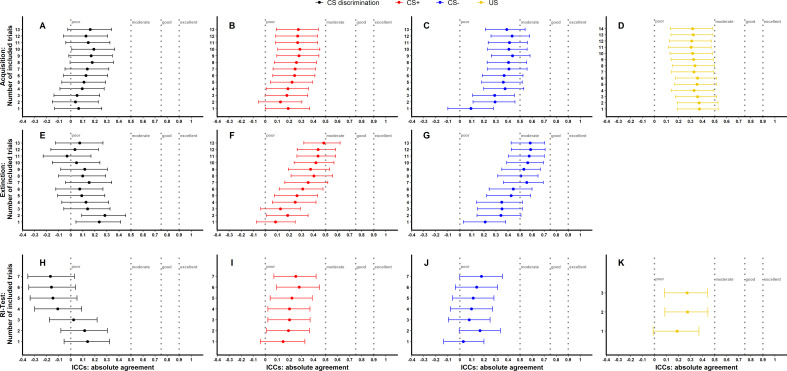
Figure 1—figure supplement 5. Illustration of ICCabs of trial-by-trial log-transformed skin conductance responses (SCRs) for phases (A–D: Acquisition, E–G: Extinction, H–J: Reinstatement-Test, K: Reinstatement) and stimulus types separately.

Figure 1—figure supplement 5.

Trials were averaged starting with the first (i.e., reinstatement-test and unconditioned stimulus [US] trials) or second trial (i.e., acquisition and extinction training). All preceding trials were added trial-by-trial and averaged. Intraclass correlation coefficients (ICCs) <0.5, <0.75, <0.9, and >0.9 (Koo and Li, 2016) were interpreted as poor, moderate, good, and excellent, respectively. Error bars represent 95% confidence intervals. Non-overlapping error bars indicate significant differences between ICCs within one figure. RI-Test = reinstatement-test.
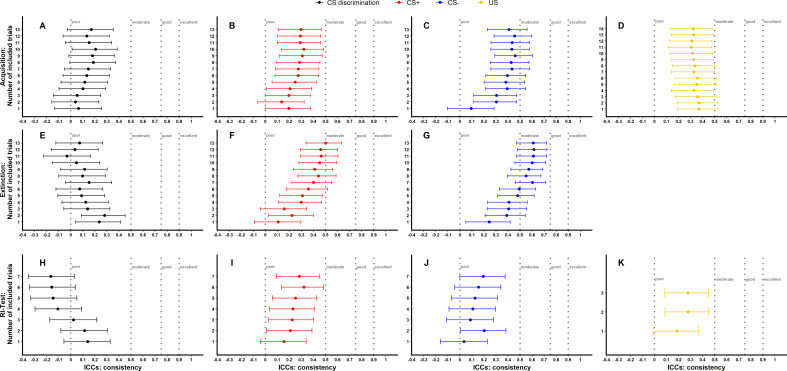
Figure 1—figure supplement 6. Illustration of ICCcon of trial-by-trial log-transformed skin conductance responses (SCRs) for phases (A–D: Acquisition, E–G: Extinction, H–J: Reinstatement-Test, K: Reinstatement) and stimulus types separately.

Figure 1—figure supplement 6.

Trials were averaged starting with the first (i.e., reinstatement-test and unconditioned stimulus [US] trials) or second trial (i.e., acquisition and extinction training). All preceding trials were added trial-by-trial and averaged. Intraclass correlation coefficients (ICCs) <0.5, <0.75, <0.9, and >0.9 (Koo and Li, 2016) were interpreted as poor, moderate, good and excellent, respectively. Error bars represent 95% confidence intervals. Non-overlapping error bars indicate significant differences between ICCs within one figure. RI-Test = reinstatement-test.
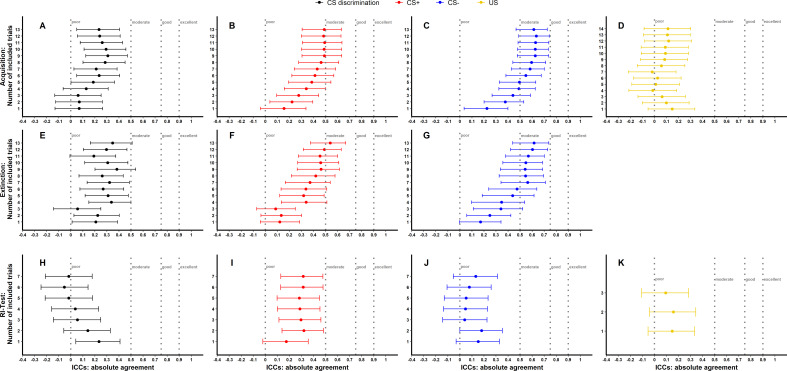
Figure 1—figure supplement 7. Illustration of ICCabs of trial-by-trial log-transformed and range corrected skin conductance responses (SCRs) for phases (A–D: Acquisition, E–G: Extinction, H–J: Reinstatement-Test, K: Reinstatement) and stimulus types separately.

Figure 1—figure supplement 7.

Trials were averaged starting with the first (i.e., reinstatement-test and unconditioned stimulus [US] trials) or second trial (i.e., acquisition and extinction training). All preceding trials were added trial-by-trial and averaged. Intraclass correlation coefficients (ICCs) <0.5, <0.75, <0.9, and >0.9 (Koo and Li, 2016) were interpreted as poor, moderate, good, and excellent, respectively. Error bars represent 95% confidence intervals. Non-overlapping error bars indicate significant differences between ICCs within one figure. RI-Test = reinstatement-test.
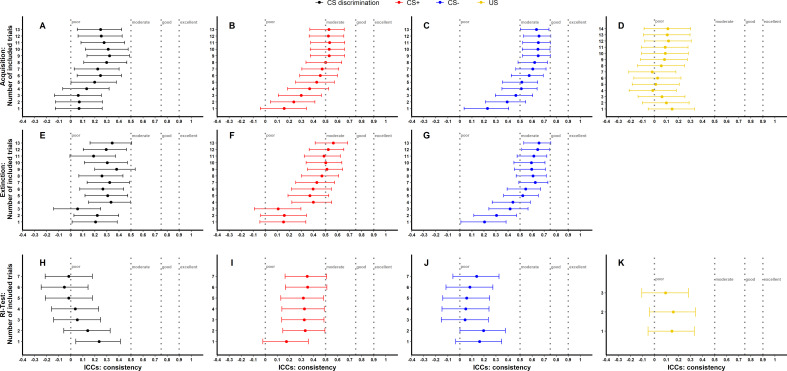
Figure 1—figure supplement 8. Illustration of ICCcon of trial-by-trial log-transformed and range corrected skin conductance responses (SCRs) for phases (A–D: Acquisition, E–G: Extinction, H–J: Reinstatement-Test, K: Reinstatement) and stimulus types separately.

Figure 1—figure supplement 8.

Trials were averaged starting with the first (i.e., reinstatement-test and unconditioned stimulus [US] trials) or second trial (i.e., acquisition and extinction training). All preceding trials were added trial-by-trial and averaged. Intraclass correlation coefficients (ICCs) <0.5, <0.75, <0.9, and >0.9 (Koo and Li, 2016) were interpreted as poor, moderate, good, and excellent, respectively. Error bars represent 95% confidence intervals. Non-overlapping error bars indicate significant differences between ICCs within one figure. RI-Test = reinstatement-test.