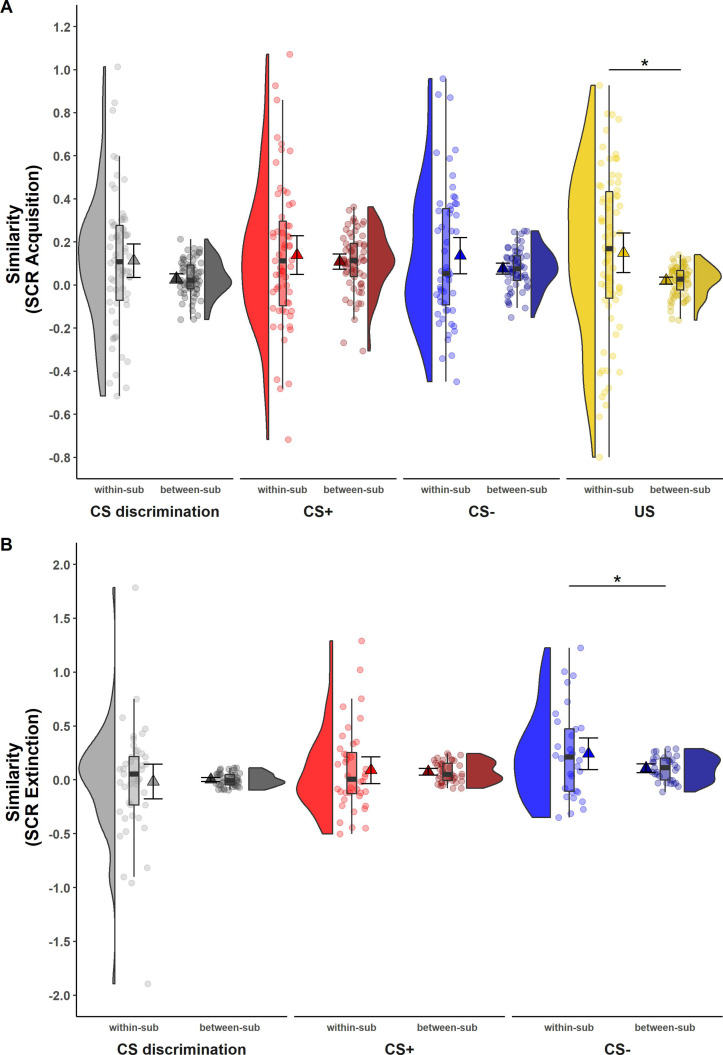
Figure 2. Illustration of within- and between-subject similarity for raw skin conductance responses (SCRs) during (A) acquisition and (B) extinction training separately for CS discrimination (gray), CS+ (red), CS− (blue), and unconditioned stimulus (US) responses (yellow).
Results for log-transformed as well as log-transformed and range corrected SCRs were almost identical to the results from raw data and are hence not reported here. Single data points represent Fisher r-to-z transformed correlations between single trial SCRs of each subject at T0 and T1 (within-subject similarity) or averaged r-to-z transformed correlations between single trial SCRs of one subject at T0 and all other subjects at T1 (between-subject similarity). Triangles represent mean correlations, corresponding error bars represent 95% confidence intervals. Boxes of boxplots represent the interquartile range (IQR) crossed by the median as bold line, ends of whiskers represent the minimum/maximum value in the data within the range of 25th/75th percentiles ±1.5 IQR. Distributions of the data are illustrated by densities next to the boxplots. One data point had a similarity above 3.5 (within-subject similarity of SCRs to the CS+) and is not shown in the figure. *p < 0.05. Note that the variances differ strongly between within- and between-subject similarity because between-subject similarity is based on correlations averaged across subjects, whereas within-subject similarity is based on non-averaged correlations calculated for each subject. Note also that similarity calculations were based on different sample sizes for acquisition and extinction training and CS discrimination as well as SCRs to the CS+, CS−, and US, respectively (for details, see Materials and methods). within-sub = within-subject; between-sub = between-subject.

