. 2022 Sep 13;11:e78717. doi: 10.7554/eLife.78717

Figure 4. Scatter plots illustrating longitudinal reliability at the group level during (A) acquisition and (B) extinction training for raw skin conductance responses (SCRs) (in μS).

Results for log-transformed as well as log-transformed and range corrected data are presented in Figure 4—figure supplement 1. Longitudinal reliability at the group level refers to the extent of explained variance in linear regressions comprising SCRs at T0 as independent and SCRs at T1 as dependent variable. Results are shown for trial-by-trial group average SCRs to the CS+ (red), CS− (blue), the unconditioned stimulus (US; yellow), and CS discrimination (black). Single data points represent pairs of single trials at T0 and T1 averaged across participants. Note that no US was presented during extinction training and hence, no reliability of the US is shown in (B).

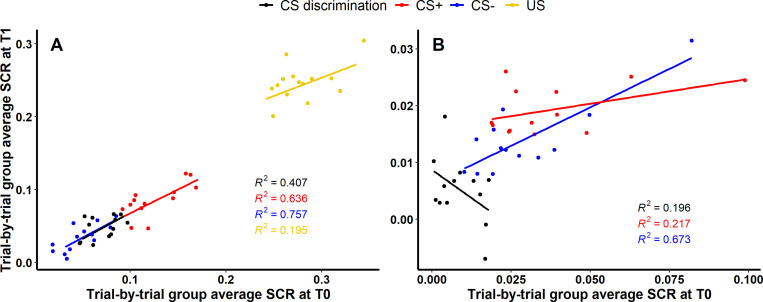
Figure 4.

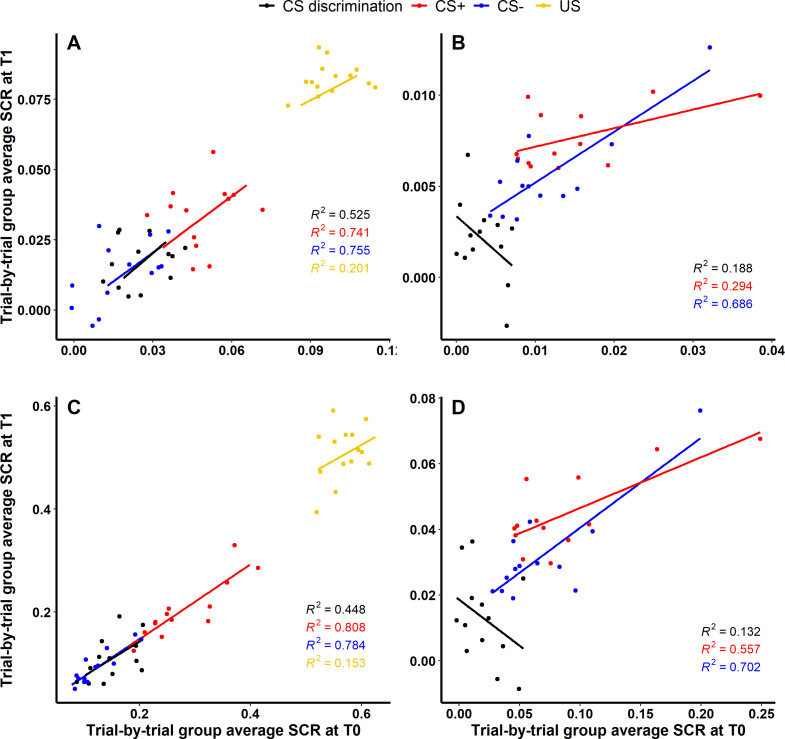
Figure 4—figure supplement 1. Scatter plots illustrating longitudinal reliability at the group level during (A, C) acquisition and (B, D) extinction training for log-transformed (A, B) as well as log-transformed and range corrected (C, D) skin conductance responses (SCRs).

Figure 4—figure supplement 1.

Longitudinal reliability at the group level refers to the explained variance in linear regressions comprising SCRs at T0 as independent and SCRs at T1 as dependent variable. Results are shown for trial-by-trial group average SCRs to the CS+ (red), CS− (blue), the unconditioned stimulus (US; yellow), and CS discrimination (black). Single data points represent pairs of single trials at T0 and T1 averaged across participants. Note that no US was presented during extinction training and hence, no reliability of the US is shown in (B) and (D).