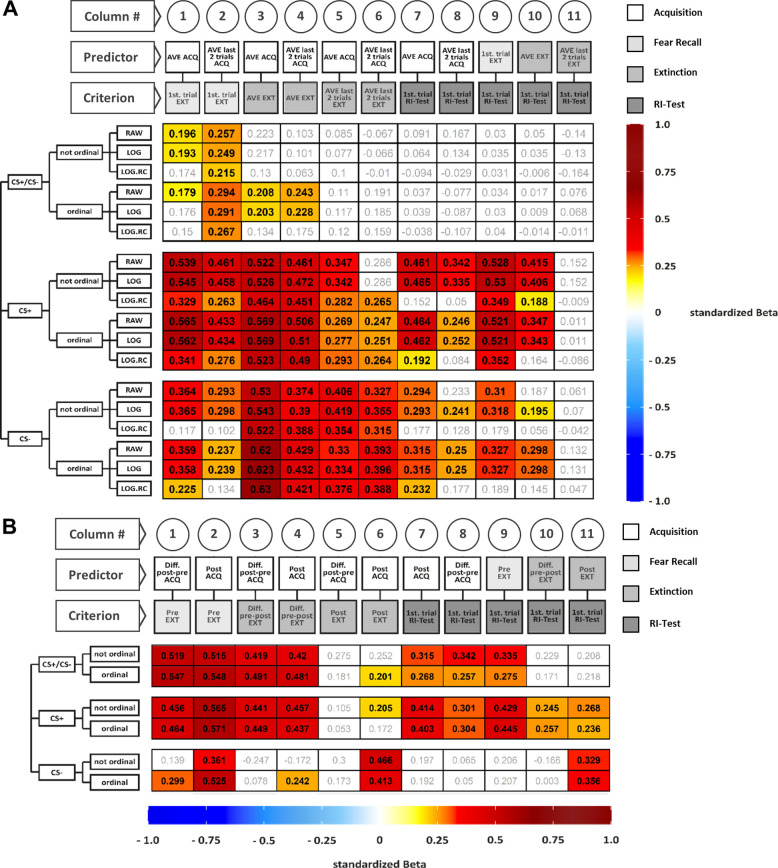
Figure 5. Illustration of standardized betas derived from regressions including skin conductance responses (SCRs) (A) and fear ratings (B) for all data specifications.
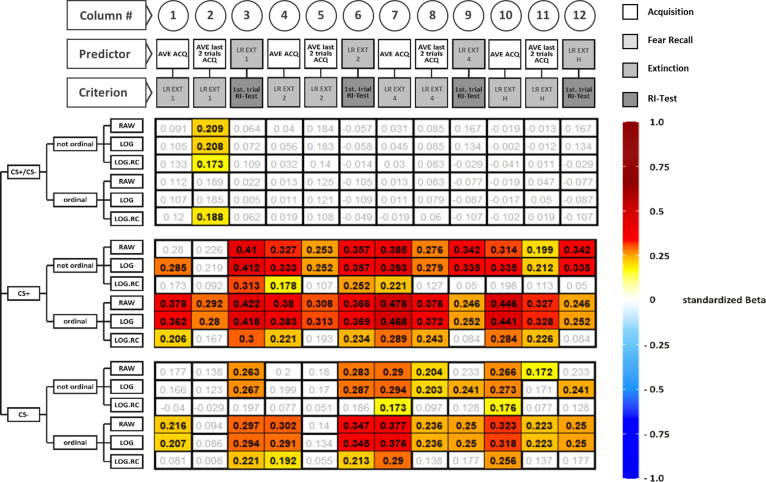
Colored cells indicate statistical significance of standardized betas, non-colored cells indicate non-significance. Standardized betas are color coded for their direction and magnitude showing positive values from yellow to red and negative values from light blue to dark blue. Darker colors indicate higher betas. On the y-axis, the following data specifications are plotted from left to right: CS type, ranking of the data and transformation of the data. On the x-axis, the following information is plotted: Number of the columns for better orientation, predictor, and criterion included in the regression. For example, the beta value at the top left in (A) (i.e., 0.196) is the standardized beta as retrieved from the linear regression including CS discrimination in non-ranked and raw SCRs during average acquisition as predictor and the first extinction trial as criterion. For exploratory non-preregistered regressions including a small manyverse of approximations of SCR extinction training learning rates, see Figure 5—figure supplement 1. Tables containing regression parameters beyond the standardized betas depicted in panels A and B are presented in Supplementary file 7 and Supplementary file 8. AVE = average, LOG = log-transformed data, LOG.RC = log-transformed and range corrected data, not ordinal = not ordinally ranked data, ordinal = ordinally ranked data.


