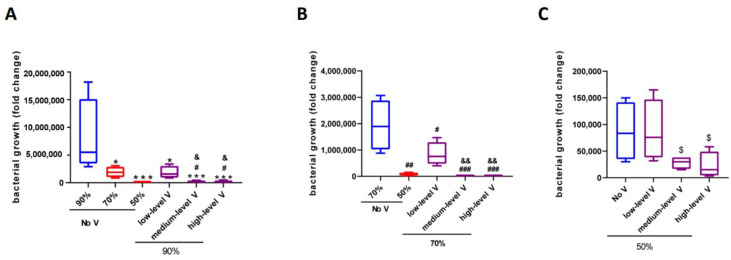
Figure 5.
The bacterial growth (fold change compared to the base value measured after washing in tap water, before placing into the cabinets) in the meat under different working conditions at 34 °C. (A) No ventilation and different ventilation levels at 90%, 34 °C; (B) no ventilation and different ventilation levels at 70%, 34 °C; (C) no ventilation and different ventilation levels at 50%, 34 °C. * p < 0.05 vs. no ventilation 90%; *** p < 0.001 vs. no ventilation 90%; # p < 0.05 vs. no ventilation 70%; ## p < 0.01 vs. no ventilation 70%; ### p < 0.001 vs. no ventilation 70%; $ p < 0.05 vs. no ventilation 50%. & p < 0.05 vs. low-level V; && p < 0.01 vs. low-level V.

