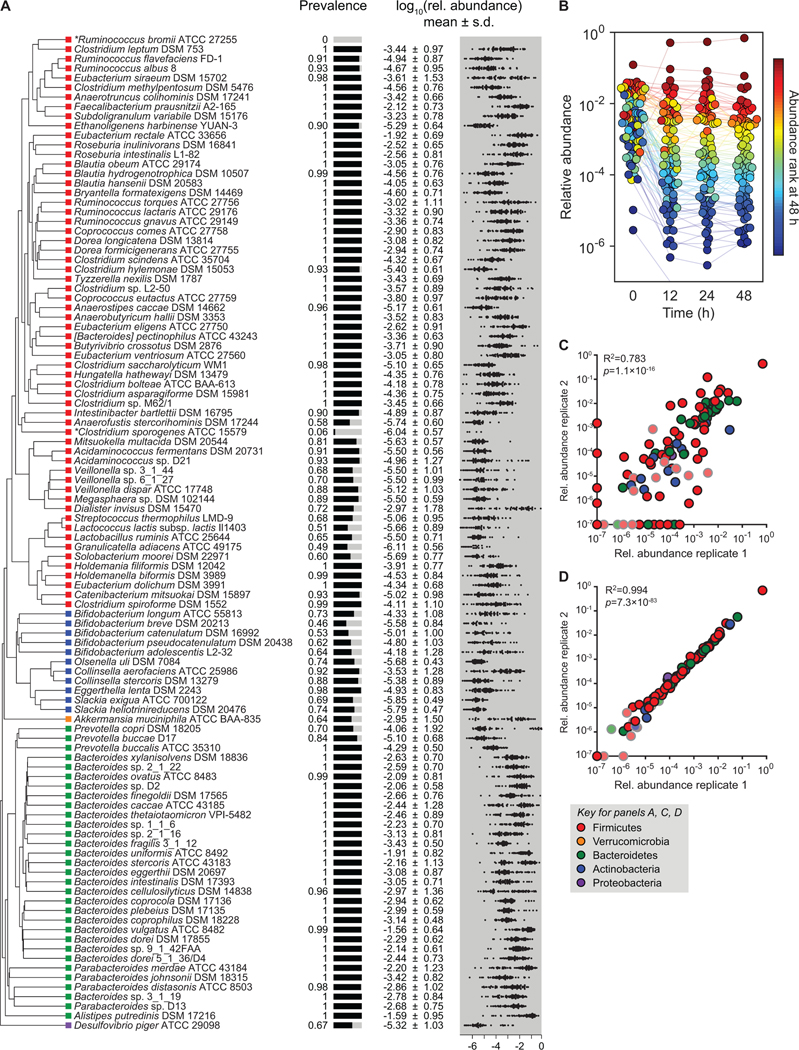
Figure 1: A complex gut bacterial community.
(A) A phylogenetic tree of the 104 strains in the community based on a multiple sequence alignment of conserved single-copy genes. The community was designed by identifying the most prevalent strains in sequencing data from the NIH Human Microbiome Project (HMP). Colored squares indicate the phylum of each strain: Firmicutes = red, Actinobacteria = blue, Verrucomicrobia = orange, Bacteroidetes = green, and Proteobacteria = purple. Also shown are the prevalence and relative abundances of each strain in the data set from the NIH HMP (n=81 subjects). The prevalence is the fraction of subjects in which the strain was detected. The distribution of log10(relative abundance) across subjects is shown with the mean denoted by a white line for each strain. Ruminococcus bromii ATCC 27255 and Clostridium sporogenes ATCC 15579 were added to the community despite low prevalence in the HMP samples. (B) The community reaches a stable configuration quickly. The community was propagated in vitro in SAAC medium to test the stability of its composition. Each dot is an individual strain; the collection of dots in a column represents the community at a single time point. Strains are colored according to their rank-order abundance in the community at 48 h. By 12 h, the relative abundances of strains in the community spanned six orders of magnitude and remained largely stable through 48 h. (C) Communities generated from two inocula prepared on different days (i.e., biological replicates) have a similar architecture at 48 h. (D) Communities generated from the same inoculum (i.e., technical replicates) have a nearly identical composition at 48 h. In (C) and (D), the color of each circle represents the phylum of the corresponding species, and circles with gray outlines and faint colors represent strains whose presence could be explained by read mis-mapping.

