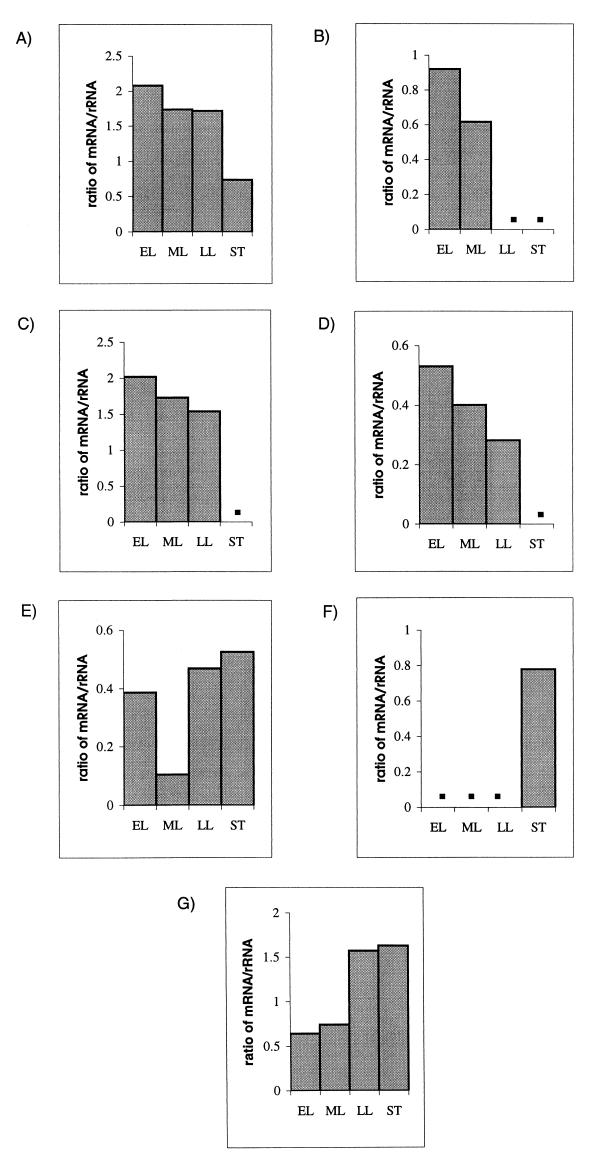
FIG. 3.
Densitometric analysis of expression of genes at early and late growth phases. Ratios of band intensities of mRNA to band intensities of the corresponding 16S rRNA from cells collected at different stages of growth are shown. EL, early log phase; ML, mid-log phase; LL, late log phase; and ST, stationary phase. Data for emm1 (A), hasA (B), scpA (C), recA (D), speA (E), speB (F), and mf (G) are shown. Densitometry was not performed for the lanes with no bands, and this is indicated by solid squares in the graphs.

