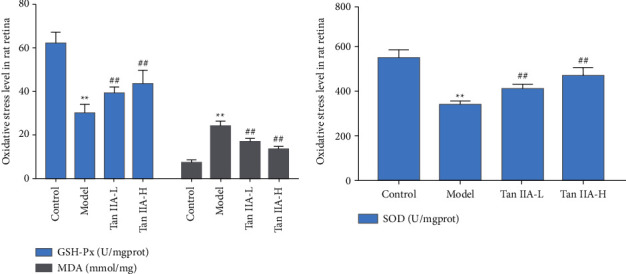
Figure 12.

Effect of tanshinone IIA on SOD, GSH-px, and MDA levels in rat retina (Tan IIA-L: tanshinone IIA low-dose group; Tan IIA-H: tanshinone IIA high-dose group; ∗∗compared with the control group, P < 0.05; ##compared with the model group, P < 0.05).
