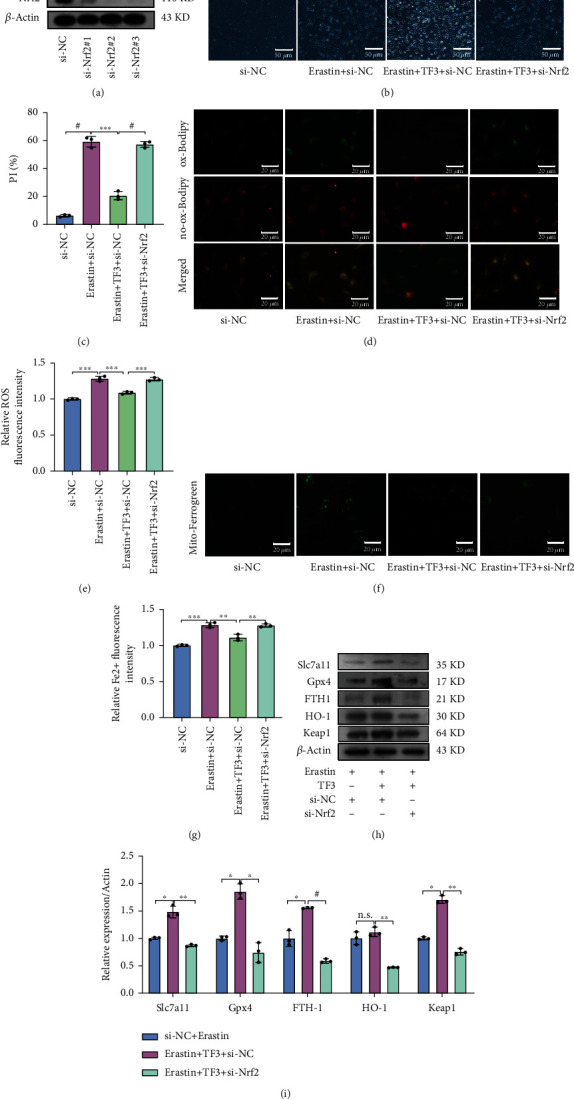
Figure 5.

Knockdown of Nrf2 reverses TF3-antiferroptosis effects in chondrocytes stimulated with erastin. (a) The expression of Nrf2 in chondrocytes with si-RNA treatments was examined by western blotting. (b) Chondrocyte ferroptosis was detected by PI staining; representative images are shown. (c) Quantitative analysis of PI positive percentage. (d) Lipid ROS levels were evaluated by fluorescent staining; representative images are shown. (e) Quantitative analysis of lipid ROS levels in chondrocytes. (f) The Fe2+ levels in mitochondria were detected by Mito-Ferrogreen staining; representative images are shown. (g) Quantitative analysis of Fe2+ level. (h) The levels of Slc7a11, Gpx4, FTH-1, HO-1, and Keap1 in chondrocytes after stimulation were examined by western blotting; representative images are shown. (i) Quantitative analysis for the expression of Slc7a11, Gpx4, FTH-1, HO-1, and Keap1 in chondrocytes. Chondrocytes were pretreated with TF3 for 2 hours and then transfected with Nrf2 si-RNA and stimulated with erastin (5 μM) for 24 hours. The data are presented as the mean ± SD of three independent experiments, and statistical significance was determined by one-way ANOVA. ∗p < 0.05, ∗∗p < 0.01, ∗∗∗p < 0.001, #p < 0.0001; n.s.: no significant difference.
