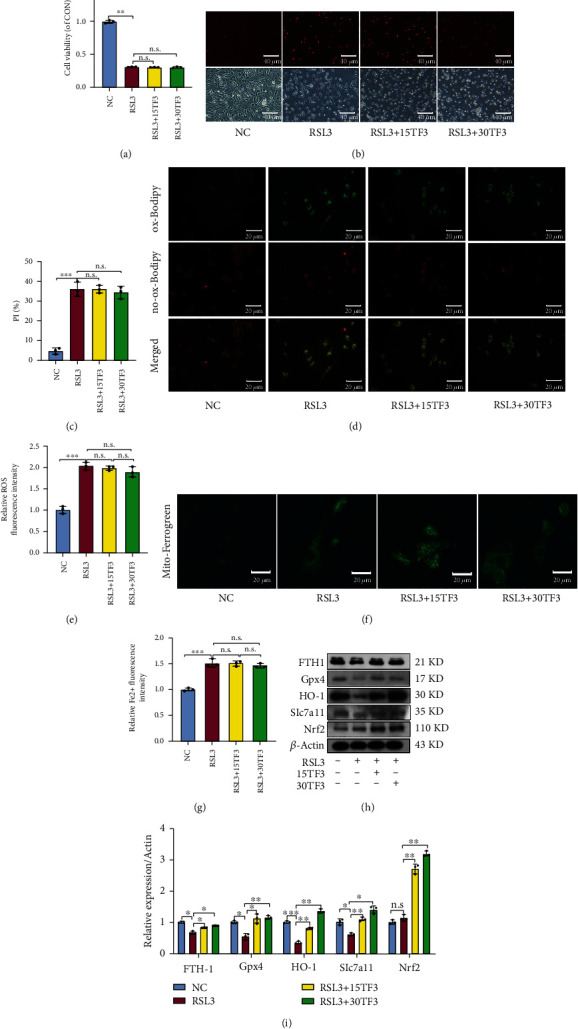
Figure 6.

TF3 fails to reverse RSL3-induced ferroptosis in chondrocytes. (a) Chondrocyte viability was measured by MTS. (b) Chondrocyte ferroptosis was detected by PI staining; representative images are shown. (c) Quantitative analysis of PI positive percentage. (d) Lipid ROS levels were evaluated by fluorescent staining; representative images are shown. (e) Quantitative analysis of lipid ROS levels in chondrocytes. (f) The Fe2+ levels in mitochondria were detected by Mito-Ferrogreen staining; representative images are shown. (g) Quantitative analysis of Fe2+ level. (h) The levels of FTH-1, Gpx4, HO-1, Slc7a11 and Nrf2 were measured by western blot; representative bands are shown. (i) Quantitative analysis for the expression of FTH-1, Gpx4, HO-1, Slc7a11, and Nrf2 in chondrocytes. The quantitative results are presented as the means ± SD of three independent experiments, and statistical significance was determined by one-way ANOVA. ∗p < 0.05, ∗∗p < 0.01, ∗∗∗p < 0.001; n.s.: no significant difference. NC: chondrocytes were cultured in DMEM-F12 for 24 hrs. RSL3: chondrocytes were pretreated with TF3 for 2 hours and then stimulated with RSL3(10 μM) for 12 hrs. FTH-1: ferritin heavy chain 1; Gpx4: glutathione peroxidase 4; HO-1: heme oxygenase-1; Slc7a11: light chain subunit of the cystine/glutamate anticarrier; Nrf2: nuclear factor erythroid 2-related factor 2.
