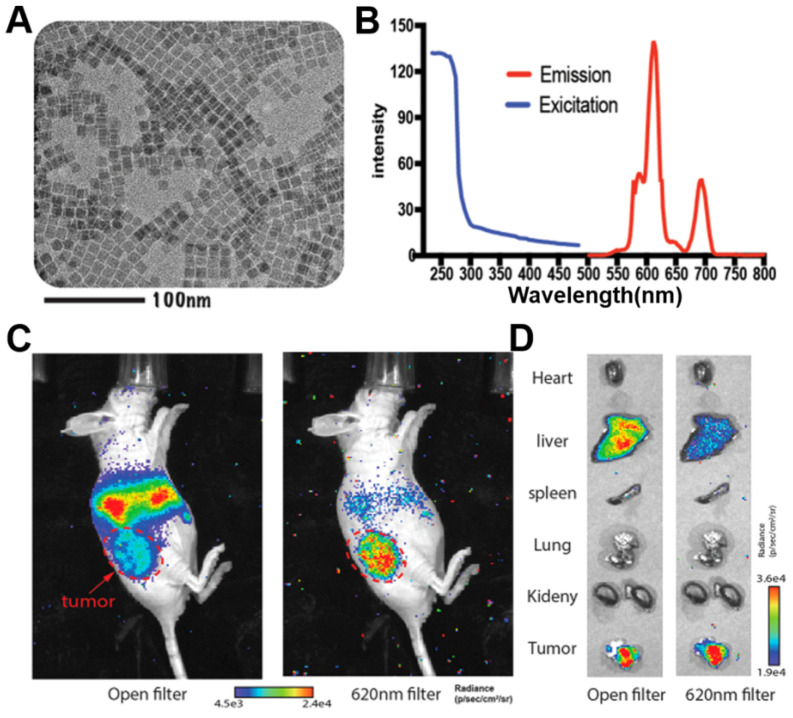
Figure 5.
(A, B) TEM image, excitation and emission spectra of ultrasmall Eu2O3 NPs. (C, D) CRET images of CT26 tumor-bearing mice and ex vivo organ imaging after 48h's injection of 89Zr- Eu2O3. Red arrow, tumor area. Reproduced with permission 50. Copyright 2021, American Chemical Society.

