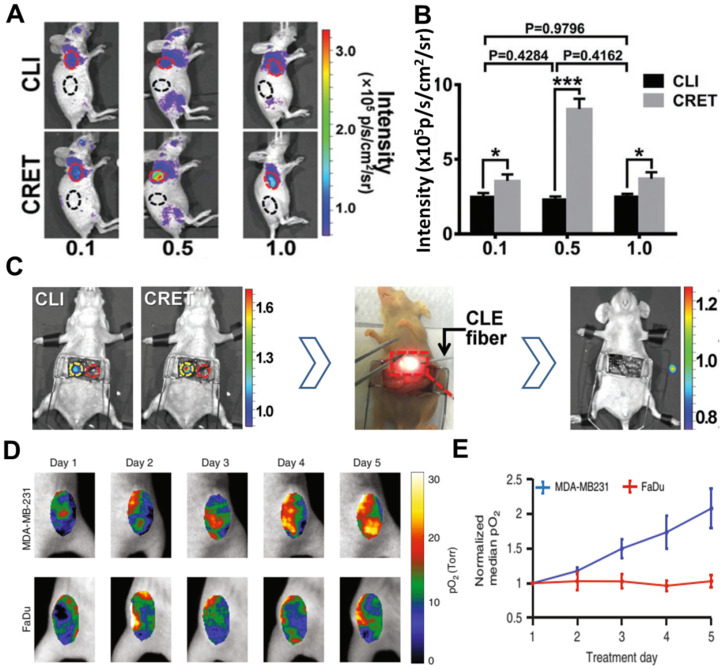
Figure 8.
(A) CR and CRET imaging of subcutaneous 4T1 tumor model after injection of 300µCi 18F-FDG (CRET group was treated with different doses of fluorescein). (B) The signal intensities and TNR of CLI and CRET. (C) Intraoperative CRI and CRET imaging of orthotropic HCC tumor model, and the process of image-guided surgery. Reproduced with permission 64. Copyright 2019, Wiley-VCH. (D, E) pO2 images and the corresponding pO2 changes during each day of radiation (6MV X-ray beam with 5 Gy/fraction), PtG4 was iv injected 24h before the first treatment. Reproduced with permission 73. Copyright 2019, Nature Publishing Group.

