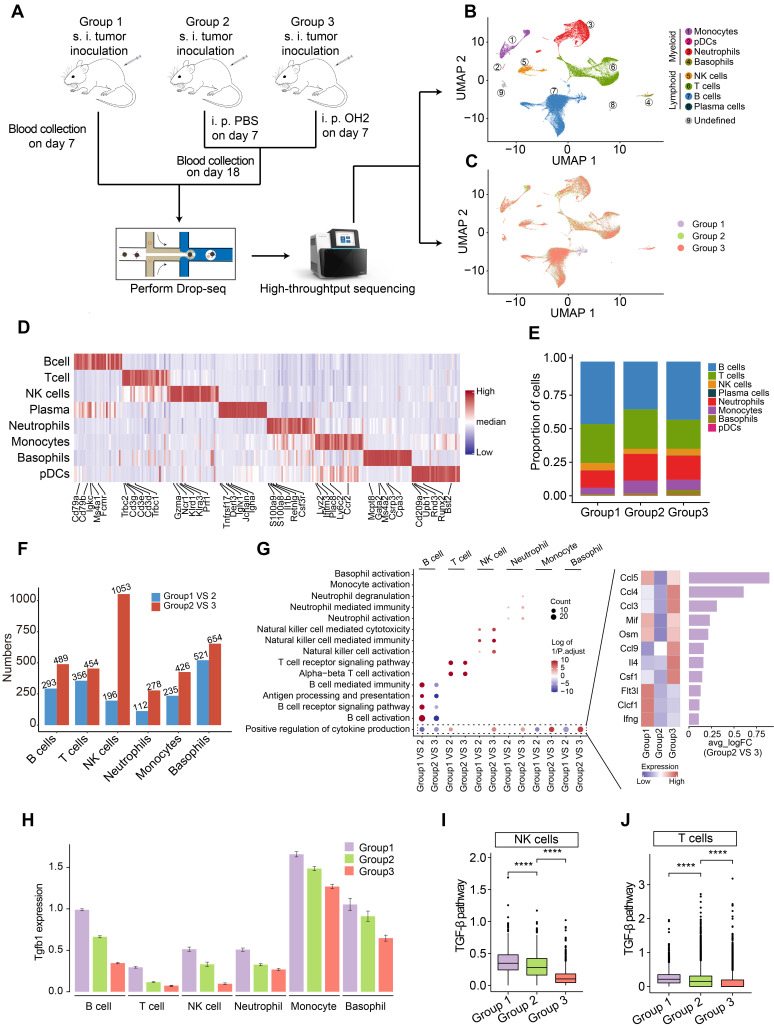
Figure 1.
scRNA-seq experiment and data analysis. (A) A schematic diagram showing the overall experimental design in this study. s.c., subcutaneous injection, i.t., intratumoral injection. (B-C) UMAP plots represent the clusters (B) and groups (C) of peripheral immune cells from 12 mice. (D) A heatmap representing scaled expression values of the top 30 genes defining each type of immune cell. (E) The composition of immune cells in the peripheral blood from three experimental groups. (F) The number of differentially expressed genes in each type of immune cell caused by increased tumor burden (blue bars) and by OH2 (red bars). (G) Left panel showing the GO terms enriched by the differentially expressed genes caused by increased tumor burden and by OH2. Red and blue dots indicate that the corresponding GO terms were enriched by upregulated genes and downregulated genes, respectively. Right panel showing the mean expression of cytokines upregulated in group 3. (H) The Tgfb1 expression level of each immune cell type from three experimental groups. (I-J) Box plots representing the activity of the TGF-β pathway in NK cells (I) and in T cells (J) from three experimental groups, respectively.

