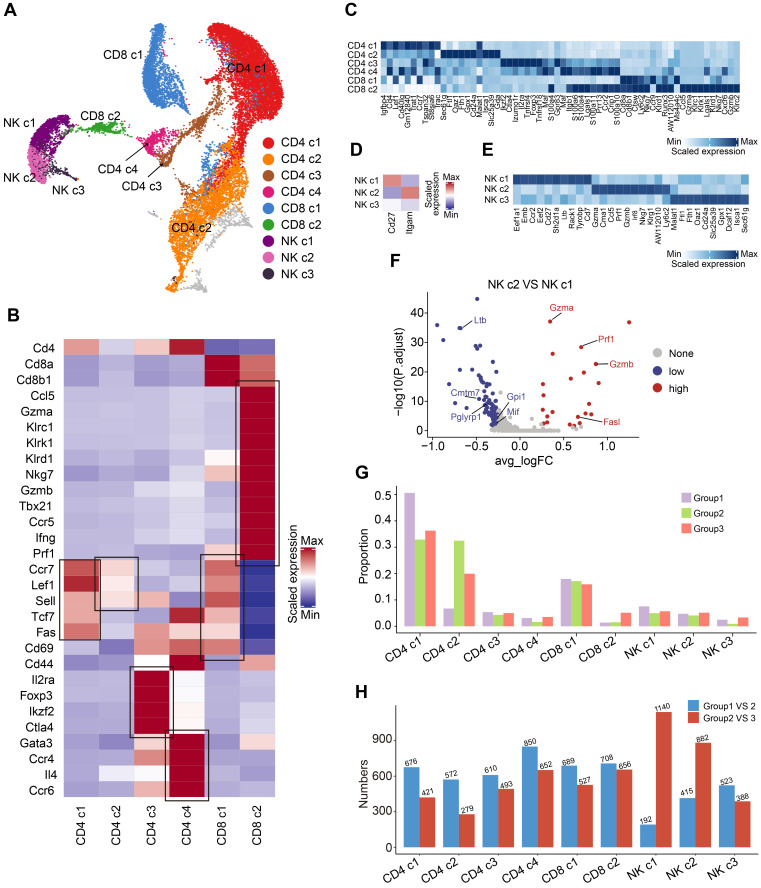
Figure 2.
Compositional changes of the T cells and NK cells. (A) A UMAP displaying the subclusters of T cells and NK cells. (B) A heatmap representing the scaled average expression of canonical T cell markers in each T cell subcluster. (C) A heatmap representing scaled expression values of the top 10 genes defining each of the T cell subclusters. (D) A heatmap showing the scaled average expression of canonical NK cell markers in each NK cell subcluster. (E) A heatmap showing scaled expression values of the top 10 genes defining each of the NK cell subclusters. (F) A volcano plot representing the differentially expressed genes between NK c2 and NK c1. (G) The composition of T and NK cell subclusters in the peripheral blood from three experimental groups. (H) The number of differentially expressed genes in each T and NK cell subcluster caused by increased tumor burden (blue bars) and by OH2 (red bards).

