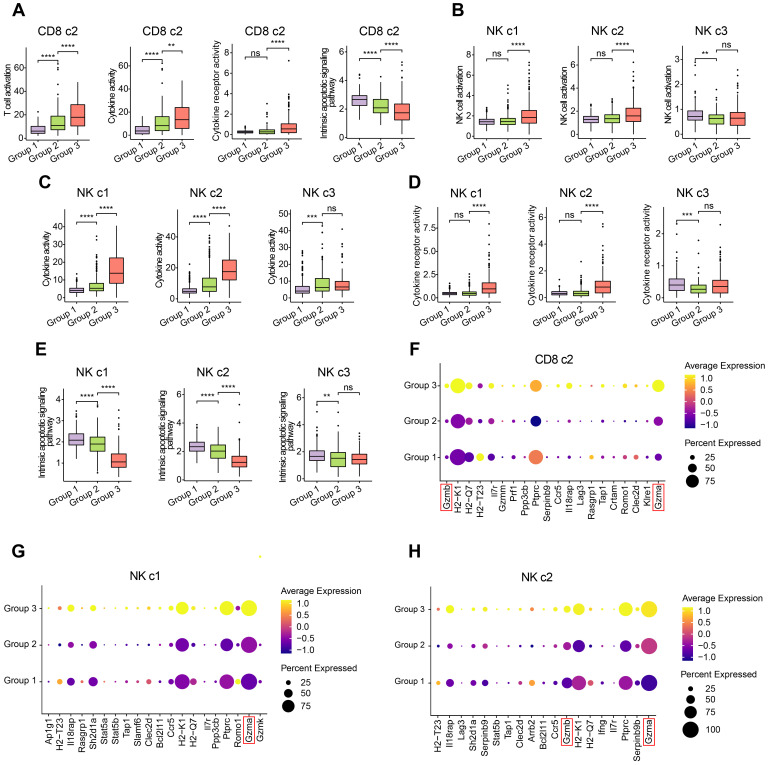
Figure 3.
Characterization of the T cells and NK cells. (A) Box plot showing the degree of T cell activation, cytokine activity, cytokine receptor activity, and intrinsic apoptotic signaling pathway in CD8 c2 from three experimental groups. (B-E) Box plot representing the degree of NK cell activation (B), cytokine activity (C), cytokine receptor activity (D), and intrinsic apoptotic signaling pathway (E) in NK cell subclusters from three experimental groups. (F-H) Dot plot showing the key cytotoxicity-related genes of CD8 c2 (F), NK c1 (G), and NK c2 (H) upregulated in group 3.

