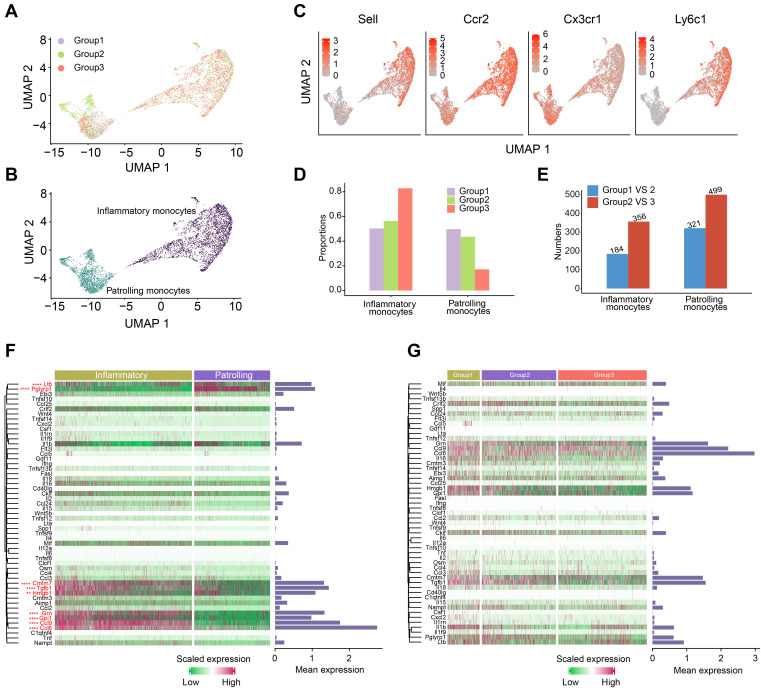
Figure 4.
Characterization of the monocytes. (A-B) UMAP plots representing the groups (A) and subclusters (B) of monocytes in the peripheral blood derived from 12 mice. (C) UMAP plots showing the expression values of canonical marker genes of monocyte subclusters. (D) The composition of monocyte subclusters in the peripheral blood from three experimental groups. (E) The number of differentially expressed genes in each monocyte subcluster caused by increased tumor burden (blue bars) and by OH2 (red bars). (F) A heatmap showing the levels of cytokines produced by inflammatory monocytes and patrolling monocytes. Bars represent the mean expression of each cytokine in monocytes. (G) A heatmap showing the levels of cytokines produced by inflammatory monocytes from three experimental groups. Bars represent the mean expression of cytokines in inflammatory monocytes.

