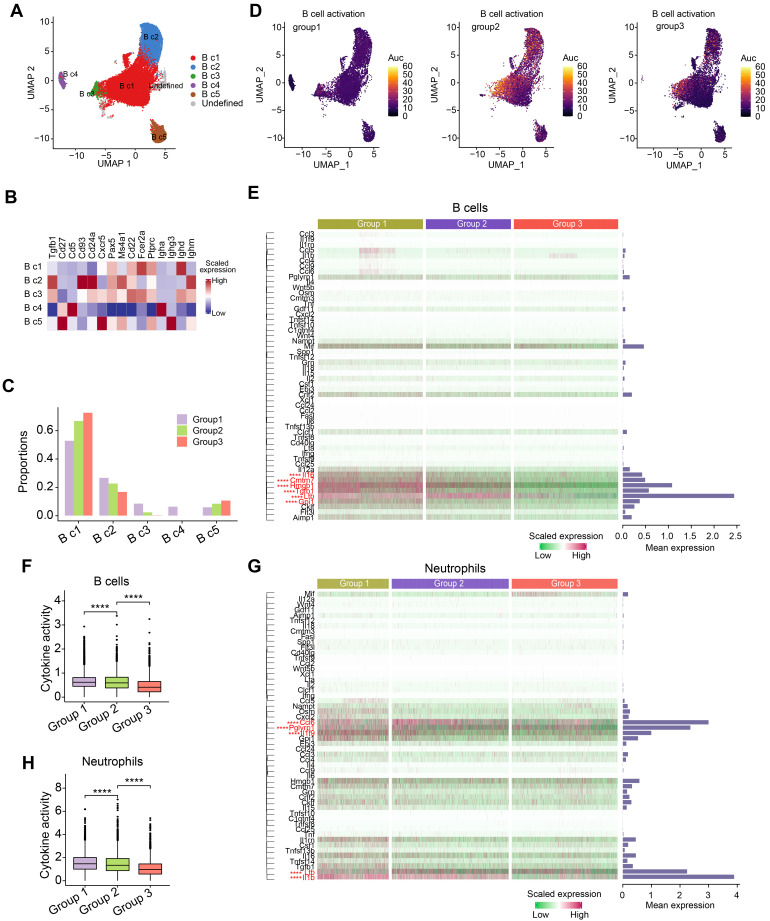
Figure 5.
Composition and characterization of B cells and neutrophils. (A) A UMAP plot representing the subclusters of B cells in the peripheral blood. (B) A heatmap representing the scaled average expression of canonical B cell markers. (C) The composition of B cell subclusters in the peripheral blood from three experimental groups. (D) UMAPs represent the degree of B cell activation measured by the AUCell algorithm. (E) A heatmap showing the levels of cytokines produced by B cells. Bars represent the mean expression of each cytokine in B cells. (F) The degree of cytokine activity in B cells from three experimental groups. (G) Heatmap showing the levels of cytokines produced by neutrophils. Bars represent the mean expression of each cytokine in neutrophils. (H) A box plot representing the degree of cytokine activity in neutrophils from three experimental groups.

