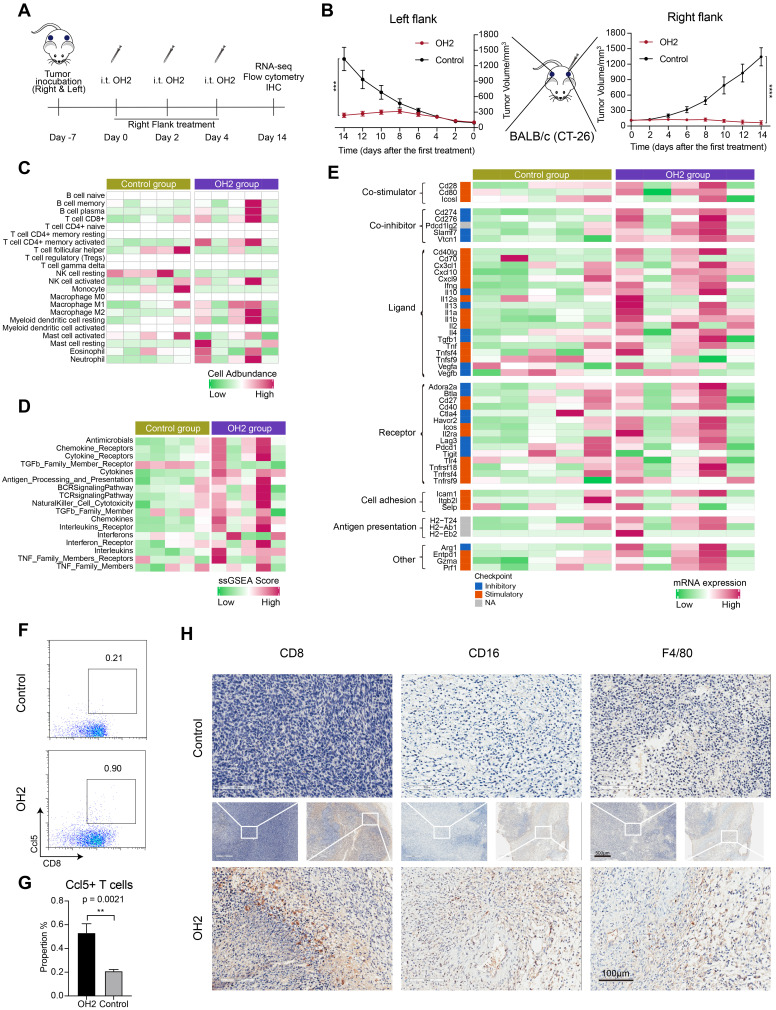
Figure 7.
Effects of OH2 on distant tumor lesions. (A) Timeline of tumor injection and treatment. At each time point, only the right-side tumor was treated. i.t., intratumoral injection. (B) The Left and right panels show the growth curves for the left and right flank tumors from the two groups (PBS and OH2), respectively (n = 6). (C-E) A heatmap showing the infiltration level of 22 types of immune cells (C), the activation degree of 17 key immune pathways (D), and the scaled expression of key immunomodulators (E) in left flank tumors of the control group and the OH2 group. (F) Representative flow cytometric analysis results of Ccl5+CD8+ T cells. (G) The percentages of Ccl5+CD8+ T cells were determined 14 days after grouping. (H) Histological appearance of representative untreated flank tumor samples from each treatment group. Middle, original magnification, × 20. Top and bottom, original magnification, × 100.

