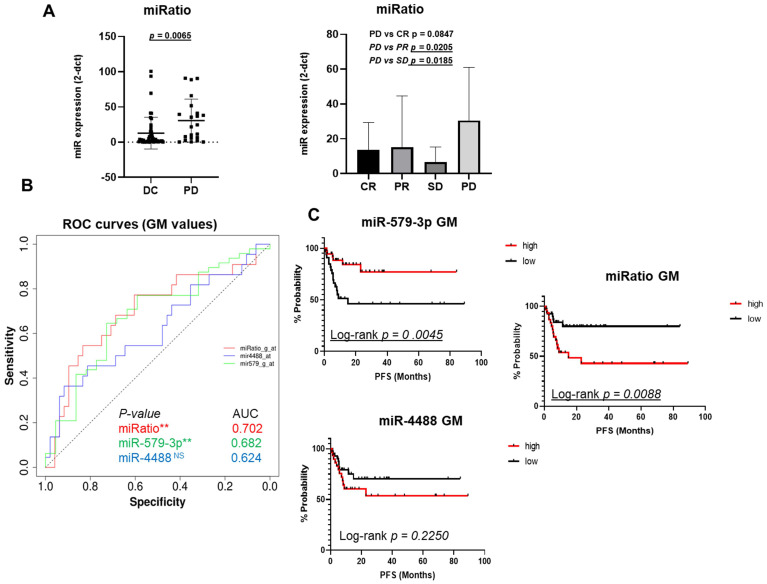
Figure 2.
The miRatio significantly (p=0.0065) distinguished BRAF-mutated melanoma patients characterized by DC vs PD responses (A, left panel). These findings were significantly confirmed also splitting the patients into the four RECIST categories (CR, PR, SD and PD) (A, right panel). The ROC curve shows that miRatio owns the best predictive value as demonstrated by the highest AUC value, i.e. 0.702, as compared to the individual miRNAs (B, red line). The Kaplan-Meier curve clearly show that high expression levels of miR-579-3p before starting therapy are a predictive factor of better PFS in metastatic melanoma patients (2C, red line upper panel) as compared to patients with lower levels of this miRNA (2C, black line upper panel). An opposite result was obtained with miR-4488 (2C, bottom panel). Finally, Kaplan-Meier curves plotted using miRatio values also confirmed a significant PFS prediction (C, right panel).

