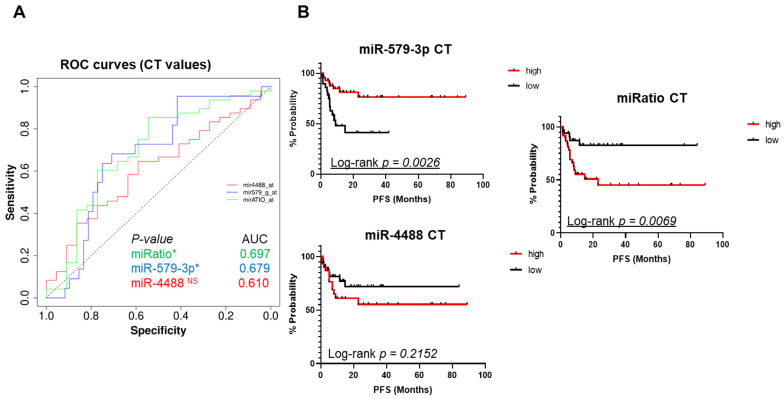
Figure 3.
Ct absolute values were used to plot ROC curves. Also in this case the miRatio generated a ROC curve with the highest AUC value (0,697) and a better statistical significance (3A, red line). Kaplan-Meier curves plotted using ROC cut-offs confirmed that higher circulating levels of miR-579-3p predicted a better PFS (3B, upper panel). On the opposite, higher levels of miR-4488 were correlated with worst PFS in melanoma patients (3B, bottom panel). Furthermore, also in this case miRatio value obtained (by using the CT values) was in line with the previous results of GM and RF normalization methods (3B, right panel). The last figure shows bar graphs where melanoma patients were separated by CT cut-off values derived from ROC curves. The group of patients with CT cut-off values below median, i.e. the one composed of high miR-579-3p expression levels, is enriched for longer PFS as compared to the group of patients with CT cut-off values above median (3C left panel). An opposite trend was found regarding miR-4488 (3C, right panel).

