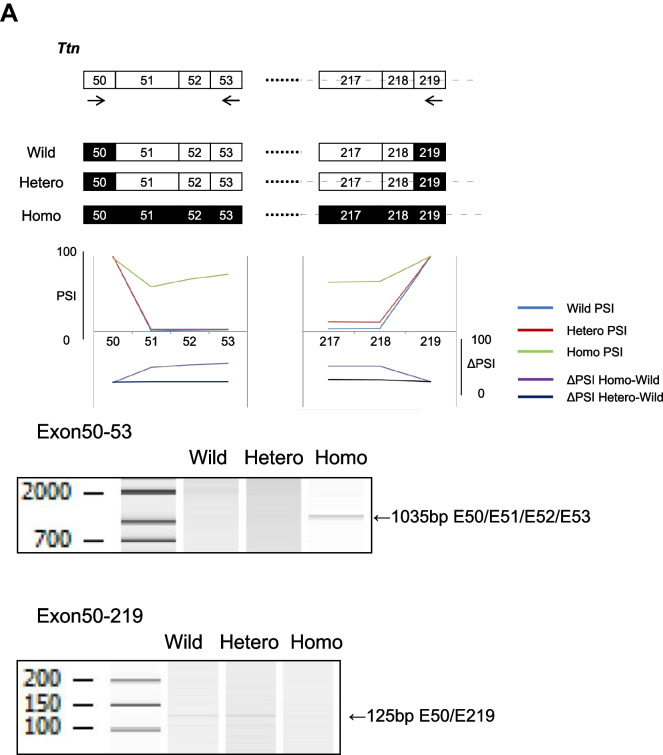
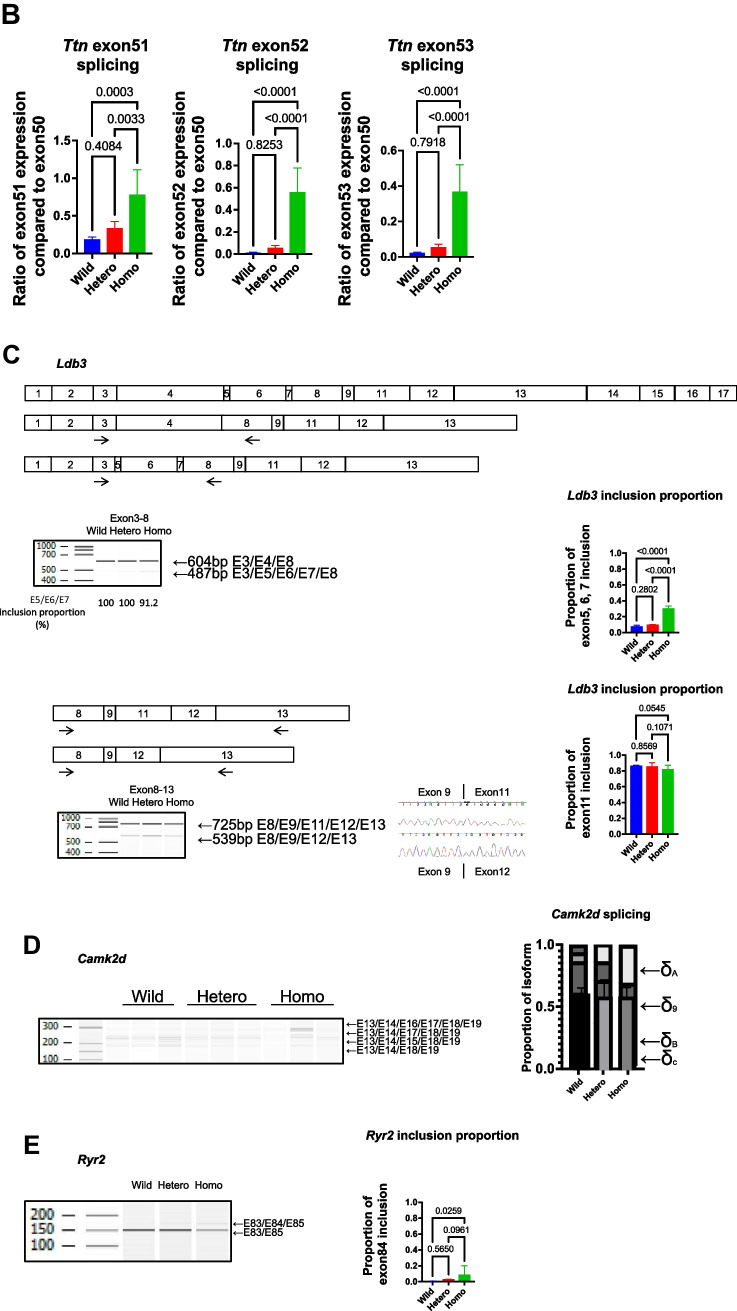
Fig. 4.
Rbm20I538T knock-in mice have abnormal splicing in the heart (RT-PCR validation). A Schematic representation of the Ttn isoform and the re-indication of the RNA-seq data are shown. The bands of RT-PCR analysis are detected in the homozygote (left, exon50-53) and in the wild-type and heterozygote (right, exon50-219). B Relative expression of Ttn exons 51, 52, and 53 compared to exon50 shows that these exons are more included in the homozygote than the wild-type and the heterozygote. n = 6 each. C Schematic representation of the Ldb3 isoforms. The RT-PCR analysis shows that exon4 (cardiac isoform, 604 bp) is included in all genotypes, whereas exons 5, 6, and 7 (skeletal isoform, 487 bp) are included predominantly in the homozygote, which was hardly detected in the wild-type or the heterozygote. The inclusion proportion is significantly different among the genotypes. n = 6 each. The RT-PCR analyses of exon11 inclusion/exclusion are shown, and there is no significant difference among the genotypes. n = 6 each. D The RT-PCR analysis of Camk2d mRNAs shows isoform differences among the genotypes. The graph shows the proportion of each isoform. E The RT-PCR analysis of Ryr2 mRNAs shows abnormal 24-bp exon inclusion in the homozygote. There is significant difference among the genotypes. n = 3 each. Error bars indicate 95% confidence interval, Tukey’s multiple comparison test


