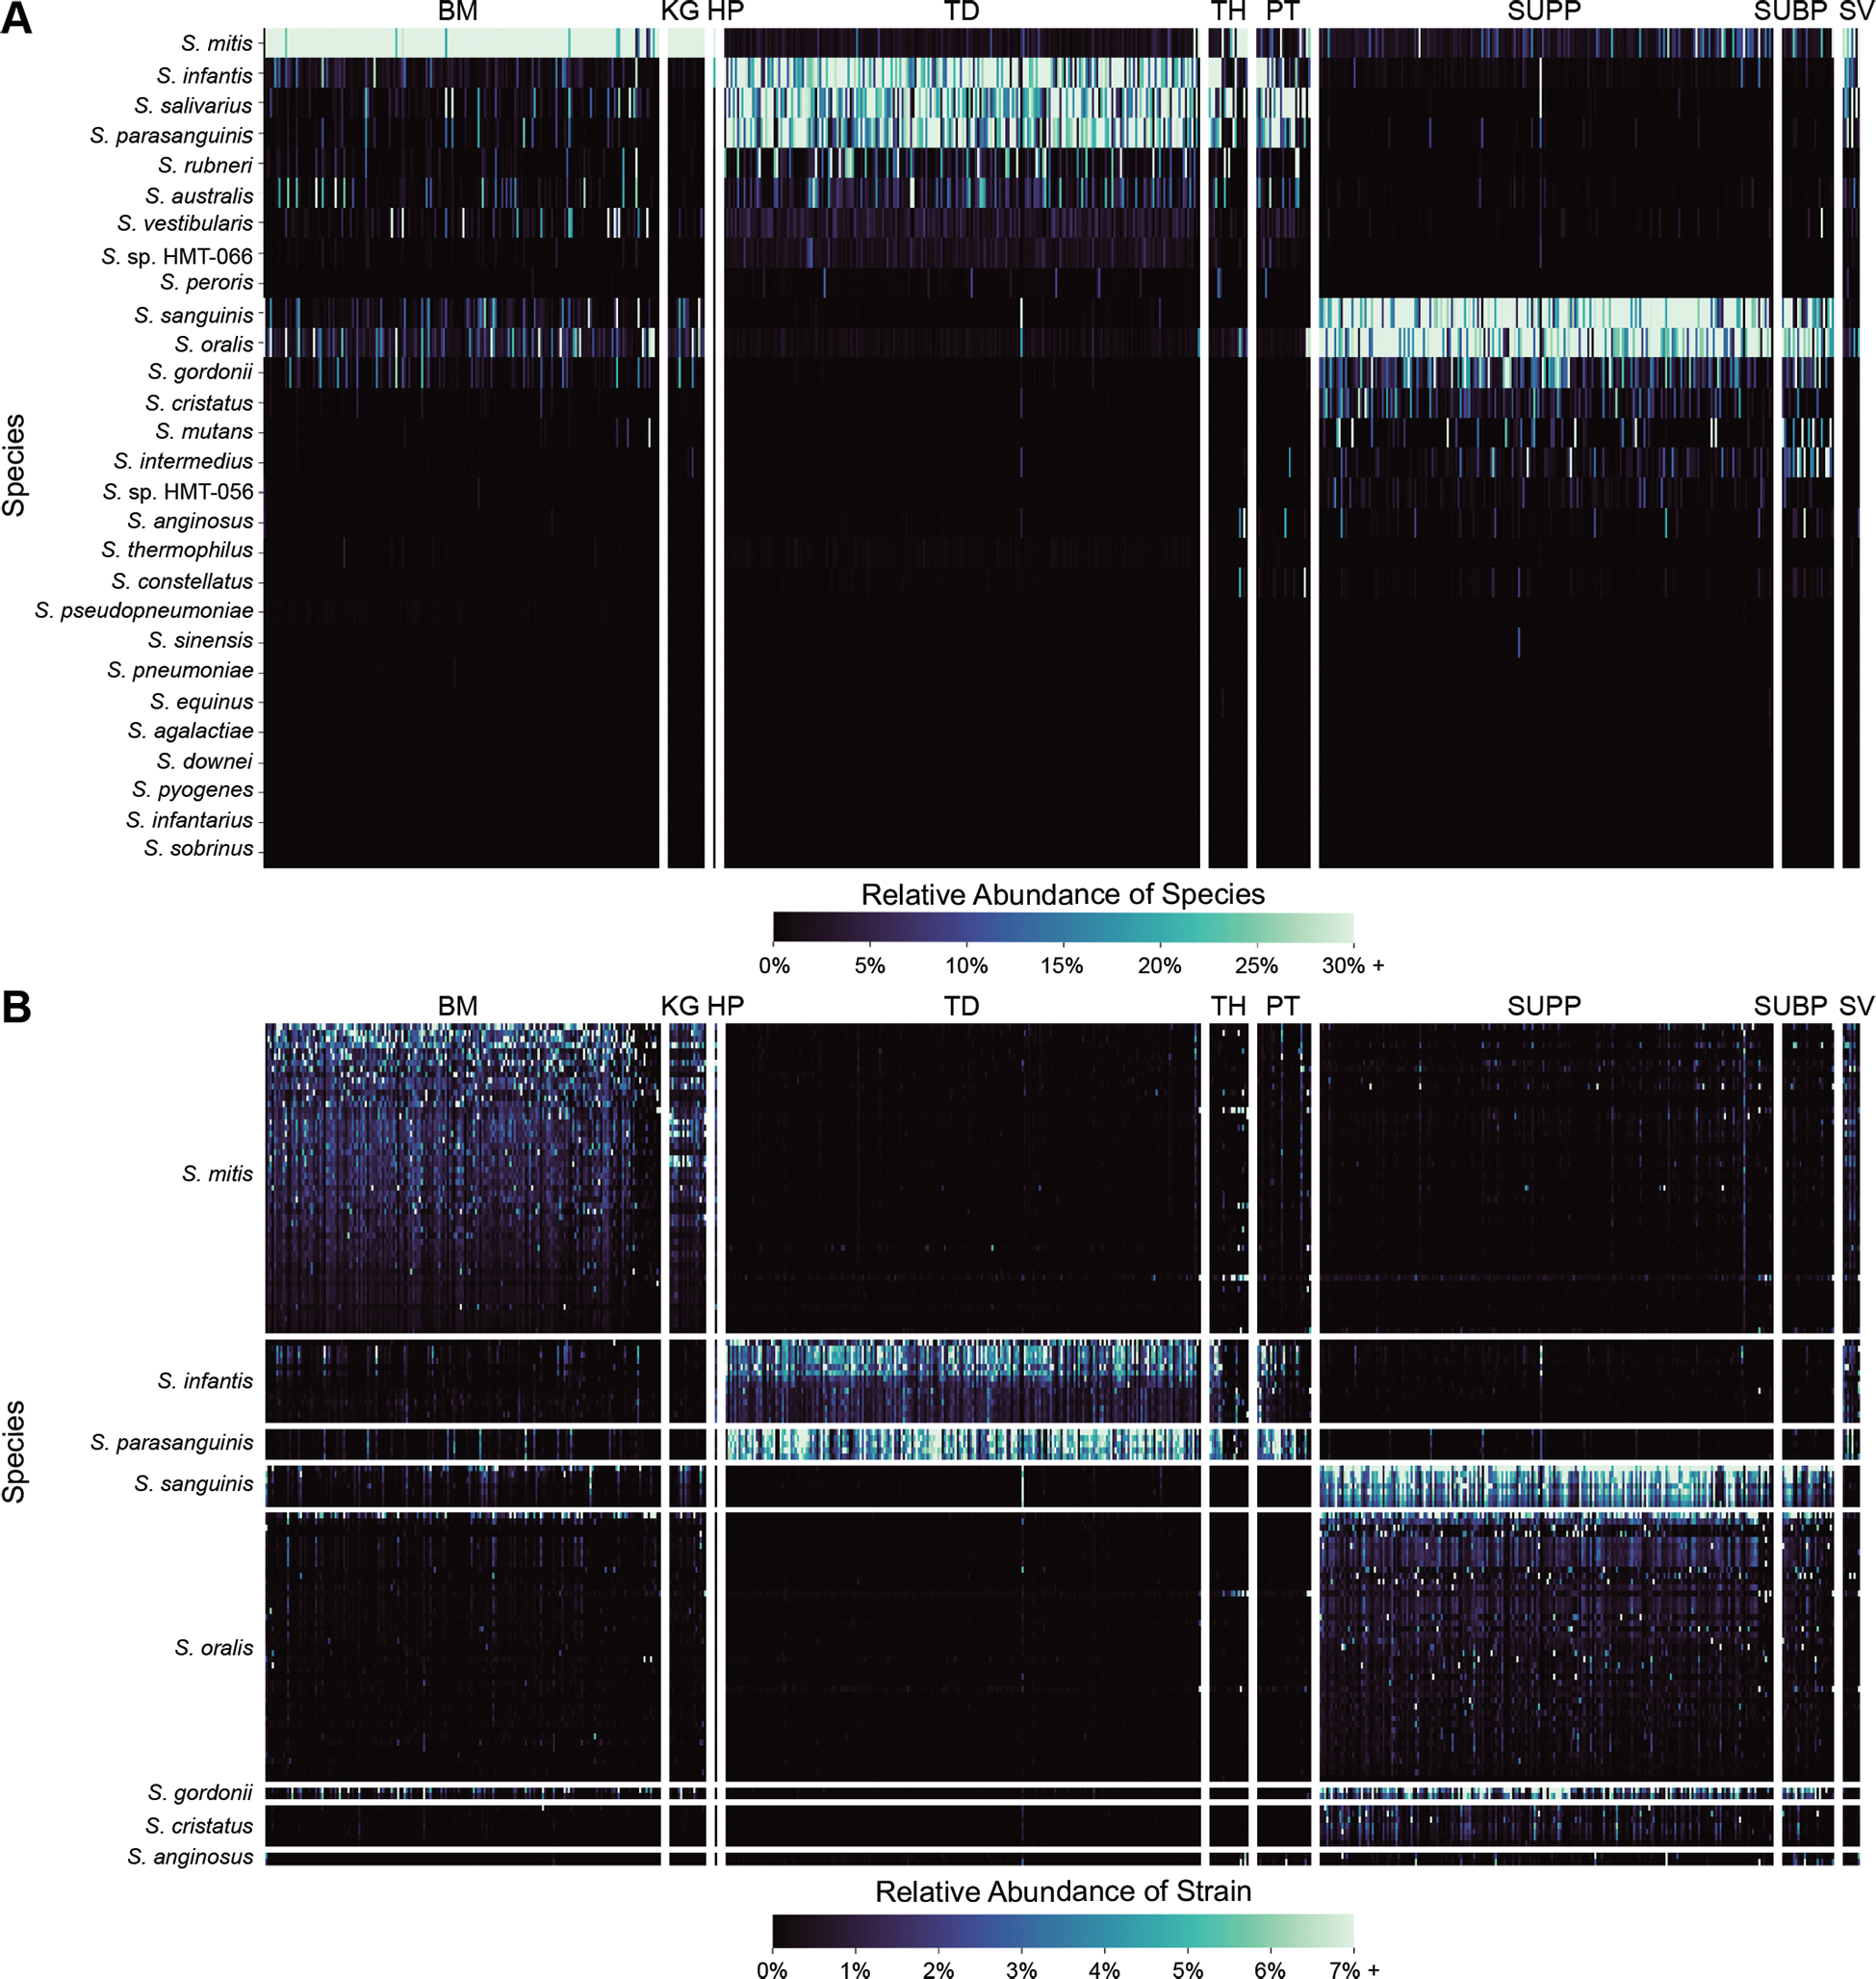
Figure 2: Mapping shows site-tropism of species and differing abundance of strains within a species.

The heatmaps show the relative abundance of oral streptococci in each of the metagenomes sampled across nine oral sites. Fig. 2A shows relative abundance of species; Fig. 2B shows relative abundance of individual strains from species with more than one representative genome. The rows and columns correspond to individual species and samples, respectively. There are 183 buccal mucosa (BM), 23 keratinized gingiva (KG), 1 hard palate (HP), 220 tongue dorsum (TD), 21 throat (TH), 31 palatine tonsils (PT), 209 supragingival plaque (SUPP), 32 subgingival plaque (SUBP), and 8 saliva (SV) samples. The samples are grouped by site and then ranked by descending number of total reads. The strains are grouped first by species and then ranked by descending mean Q2Q3 relative abundance across the site (BM, TD, or SUPP) where they are most abundant.
