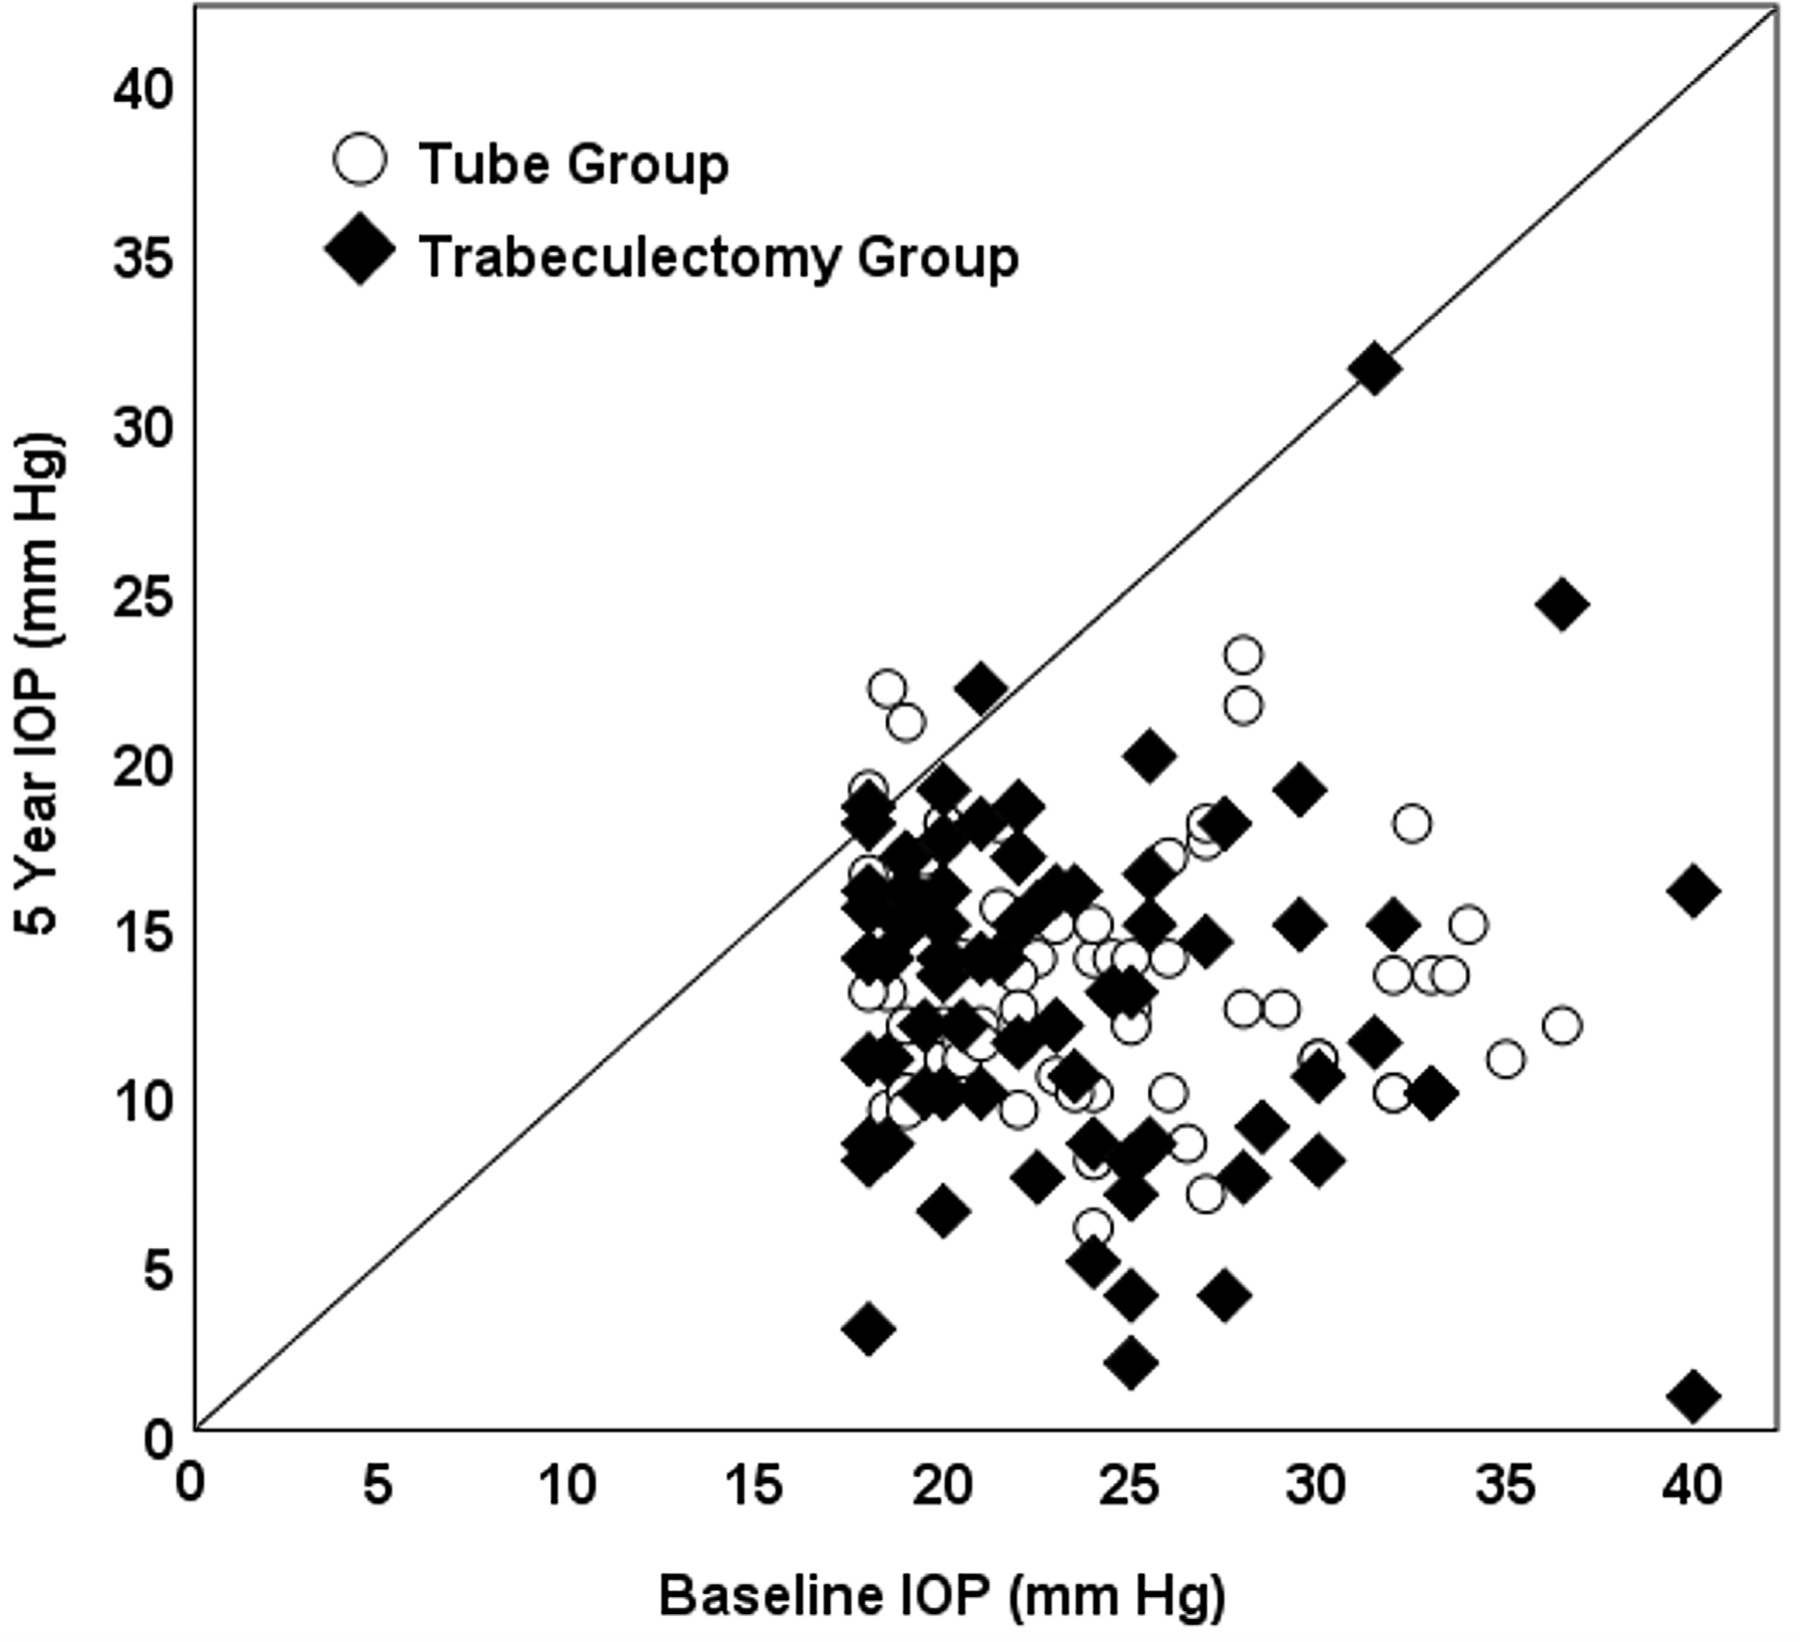
Figure 6.

Scatter plot of IOP data in the PTVT Study. Each point represents a patient in the tube group (circle) or trabeculectomy group (diamond) showing the IOP at baseline and 5 years postoperatively. The oblique line indicates no change. Patients were censored after a reoperation for glaucoma.
