
Figure 3. Univariate (left) and multivariable (right) associations for each behavior predicted by FH.
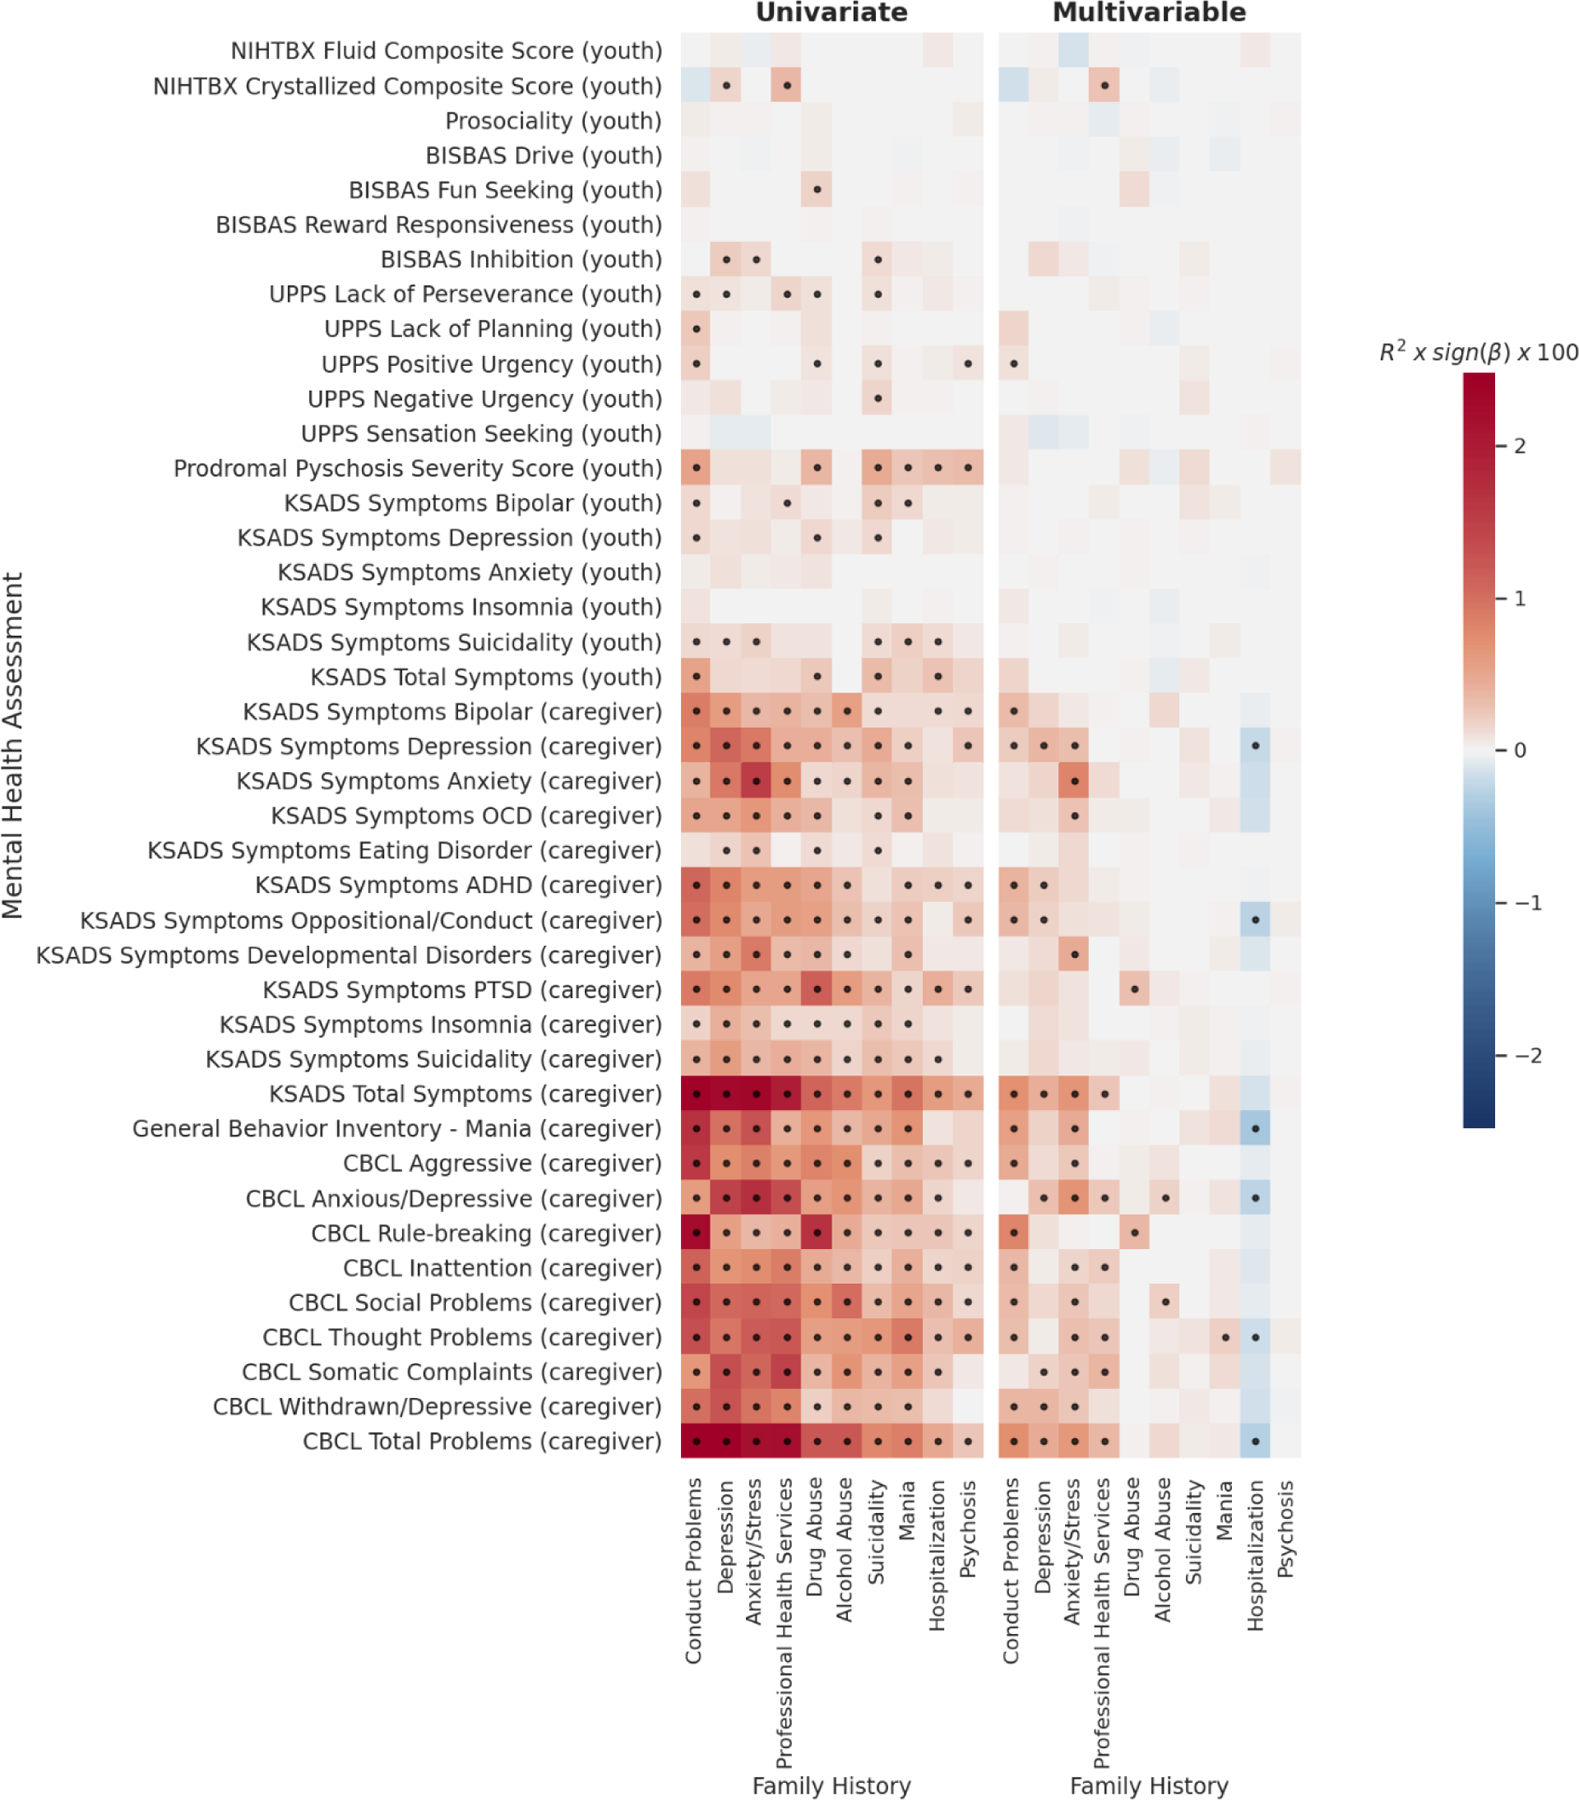
Effect sizes for each association are displayed as the partial variance explained, R2, (as a percentage) multiplied by sign of beta coefficient (red=positive, blue=negative). Response variable for each model is shown on y-axis. In univariate models (left) only a single genetic predictor was included in each model (each cell = 1 model) – i.e. behavior~FH+covariates. In multivariable models (right) all genetic/familial predictors were included in each model including all PRS and FH measures (each row = 1 model) – i.e. behavior ~ PRS1+PRS2…+FH1+FH2…+covariates. Dots indicate FDR significant associations.