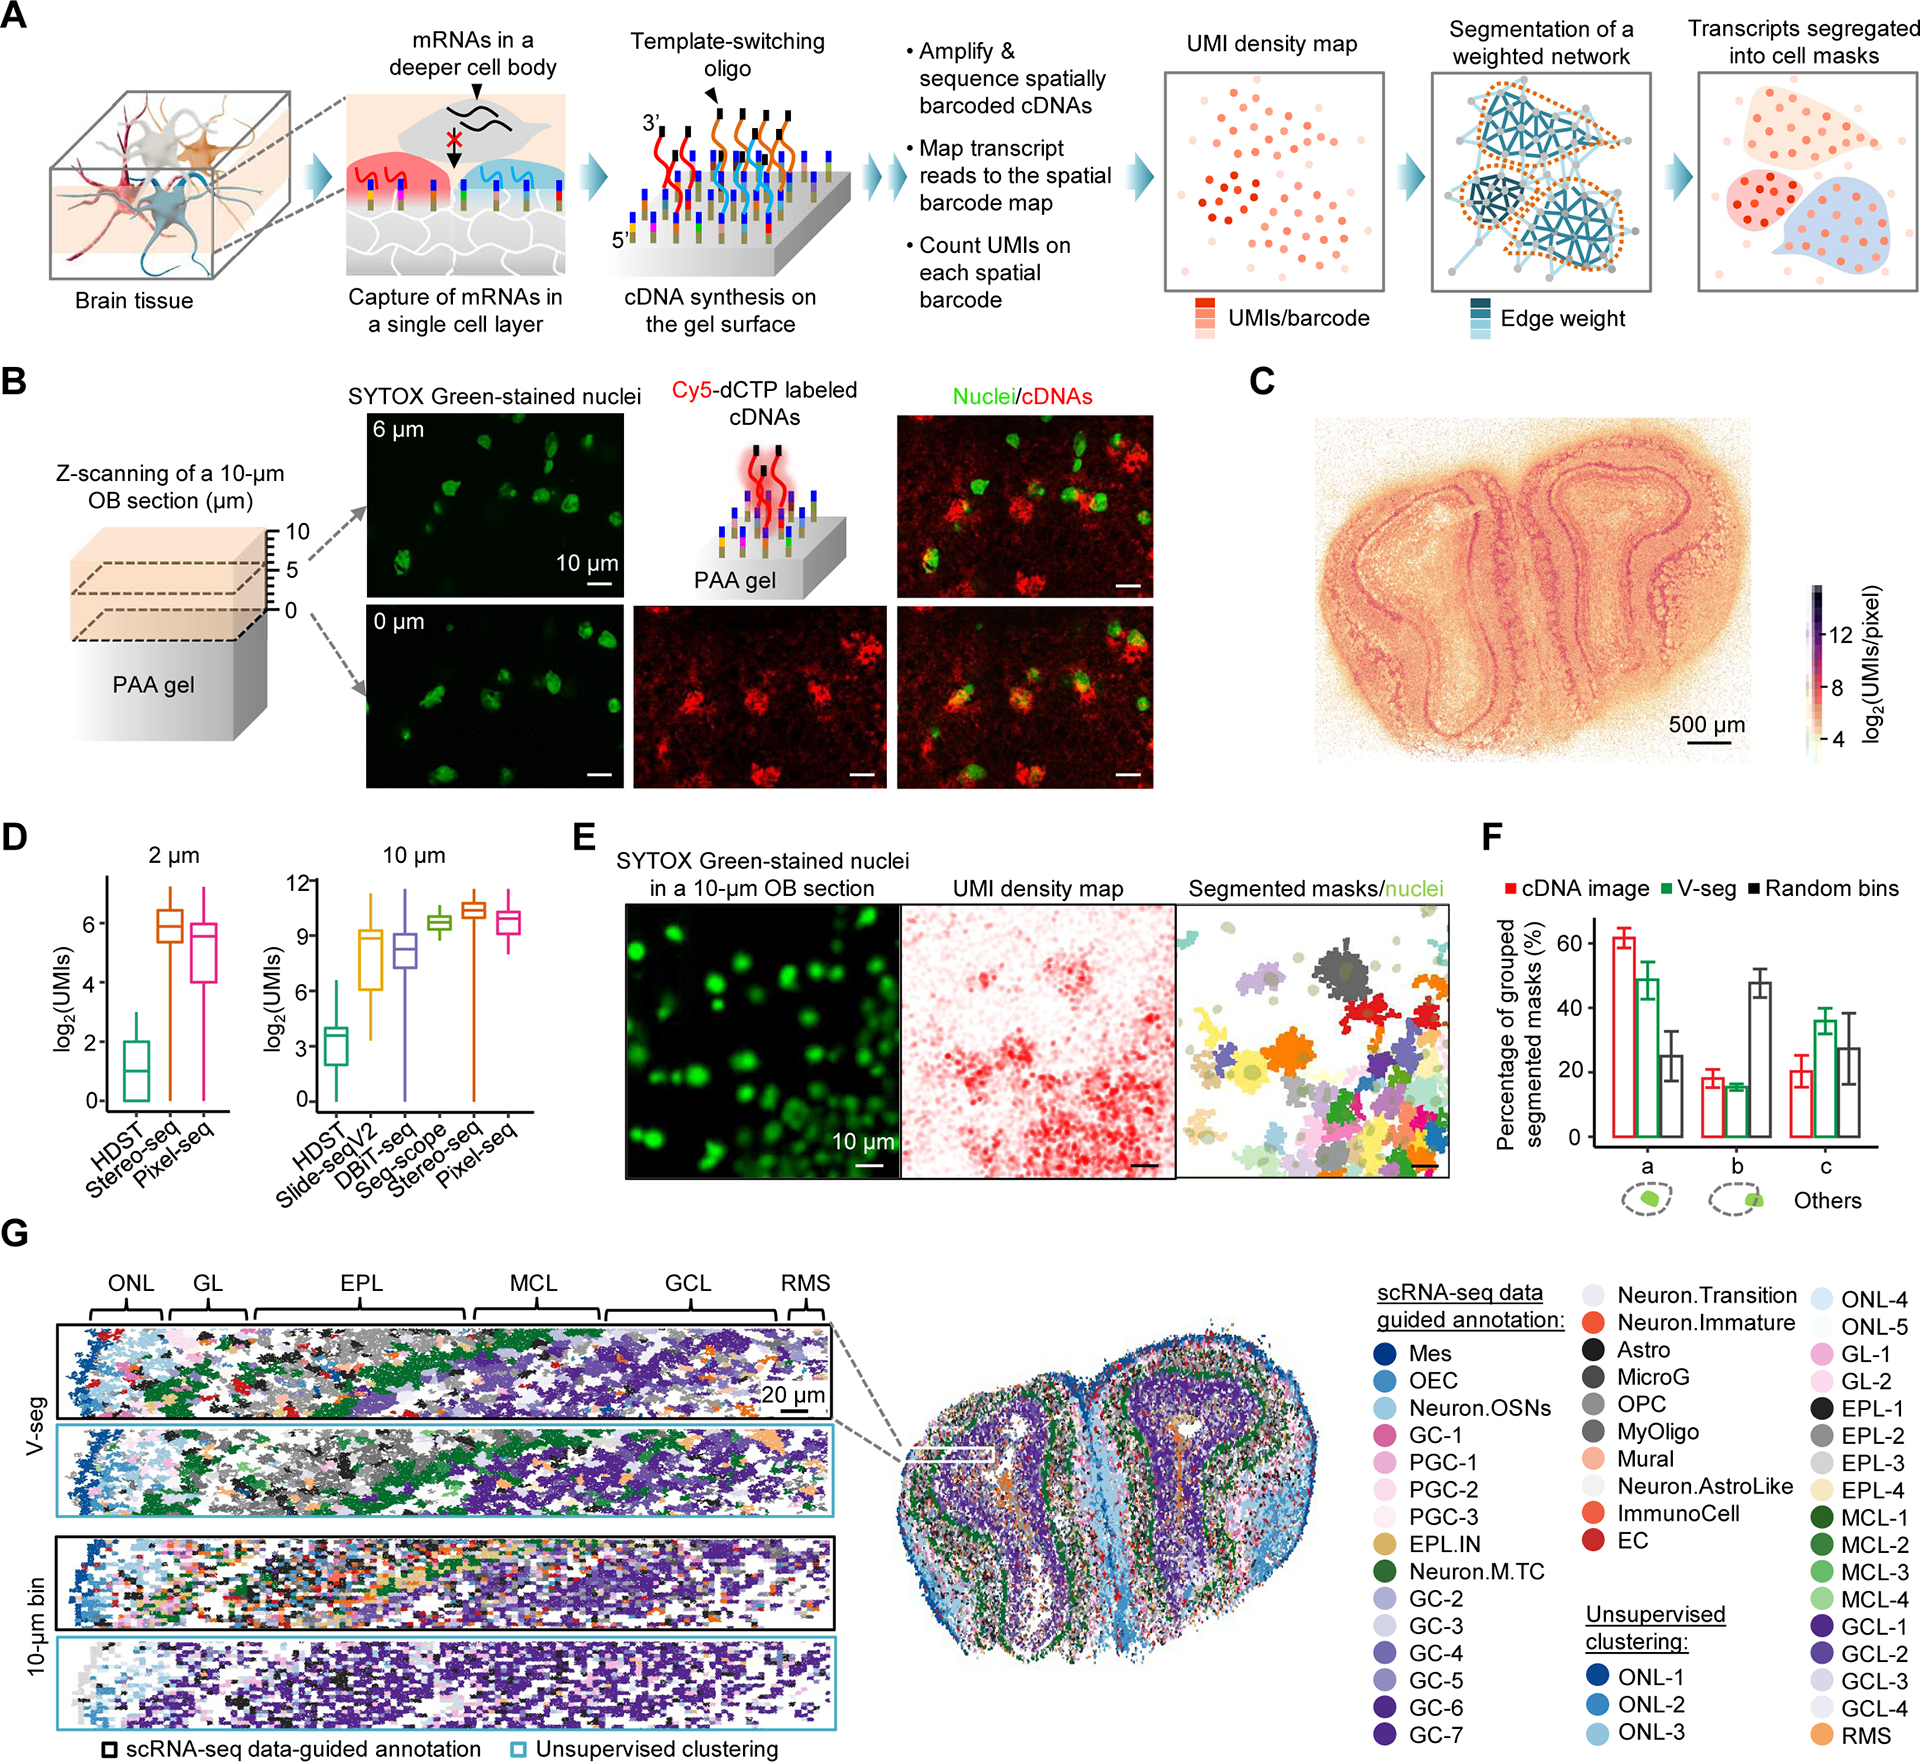
Figure 2. Pixel-seq-based single-cell spatial transcriptomics.

(A) Principle of Pixel-seq. RNAs are captured from the gel-touching cell layer in a cryosectioned tissue to synthesize barcoded cDNAs with a 3’ universal sequence introduced from a template-switching oligo for cDNA amplification. cDNAs are sequenced to associate RNAs to their gel locations to create a transcript map. A k-nearest neighbor network is built on the map where each barcode represents a node. Edge weights are calculated as a function of UMI counts, the distance and transcript similarity between two connected barcodes. The weighted network is segmented by a graph-based algorithm to create cell masks to aggregate transcripts for single-cell data analyses.
(B) Confocal analysis of stained nuclei in a mouse OB section attached to a gel and labelled cDNAs synthesized on the gel. Two detected layers of nuclei proximal (0 μm) and distal (6 μm) to the gel surface are overlaid with cDNA signals.
(C) Comparison of OB UMI density maps by RNA captures from a single (Pixel-seq) and multiple layered cells (Stereo-seq). i) Maps of total UMI densities measured on 2 × 2 μm2 bins. ii) Zoom-in comparison of the selected regions in i) (white dotted boxes). iii) Density plot of detected UMIs in the whole tissues. Means (dash lines): 45.6 and 60.5; maximums: 1,979 and 1,091.
(D) Comparison of selected gene expressions detected by Pixel-seq and the AMBA ISH data.
(E) Comparison of the capture efficiency of Pixel-seq and recent data from similar assays (see Table S1). The Pixel-seq OB UMIs were counted on bins of 7 × 7 (2 μm) and 33 × 33 (10 μm; a cutoff of 265) pixels.
(F) Validation of the V-seg result by overlaying segmented masks with stained nuclei in the same tissue. Immediately after placing the tissue on the gel pre-soaked with SYTOX Green, stained nuclei were imaged with the epifluorescence microscope used for polony gel sequencing.
(G) Comparison of the accuracy of V-seg, labelled cDNA image segmentation, and random bins of a size close to the average mask size. Results were validated by the colocalization with nuclei described in (F). a, masks containing single nuclei; b, masks partially overlapped with single nuclei; c, others including those overlapped with multiple or zero nuclei.
(H) Comparison of cell annotation outcomes of the segmentation by V-seg and random bins. Aggregated transcripts were analyzed by scRNA-seq data-guided annotation or unsupervised clustering. See full names of cell types in Figure S2G.
