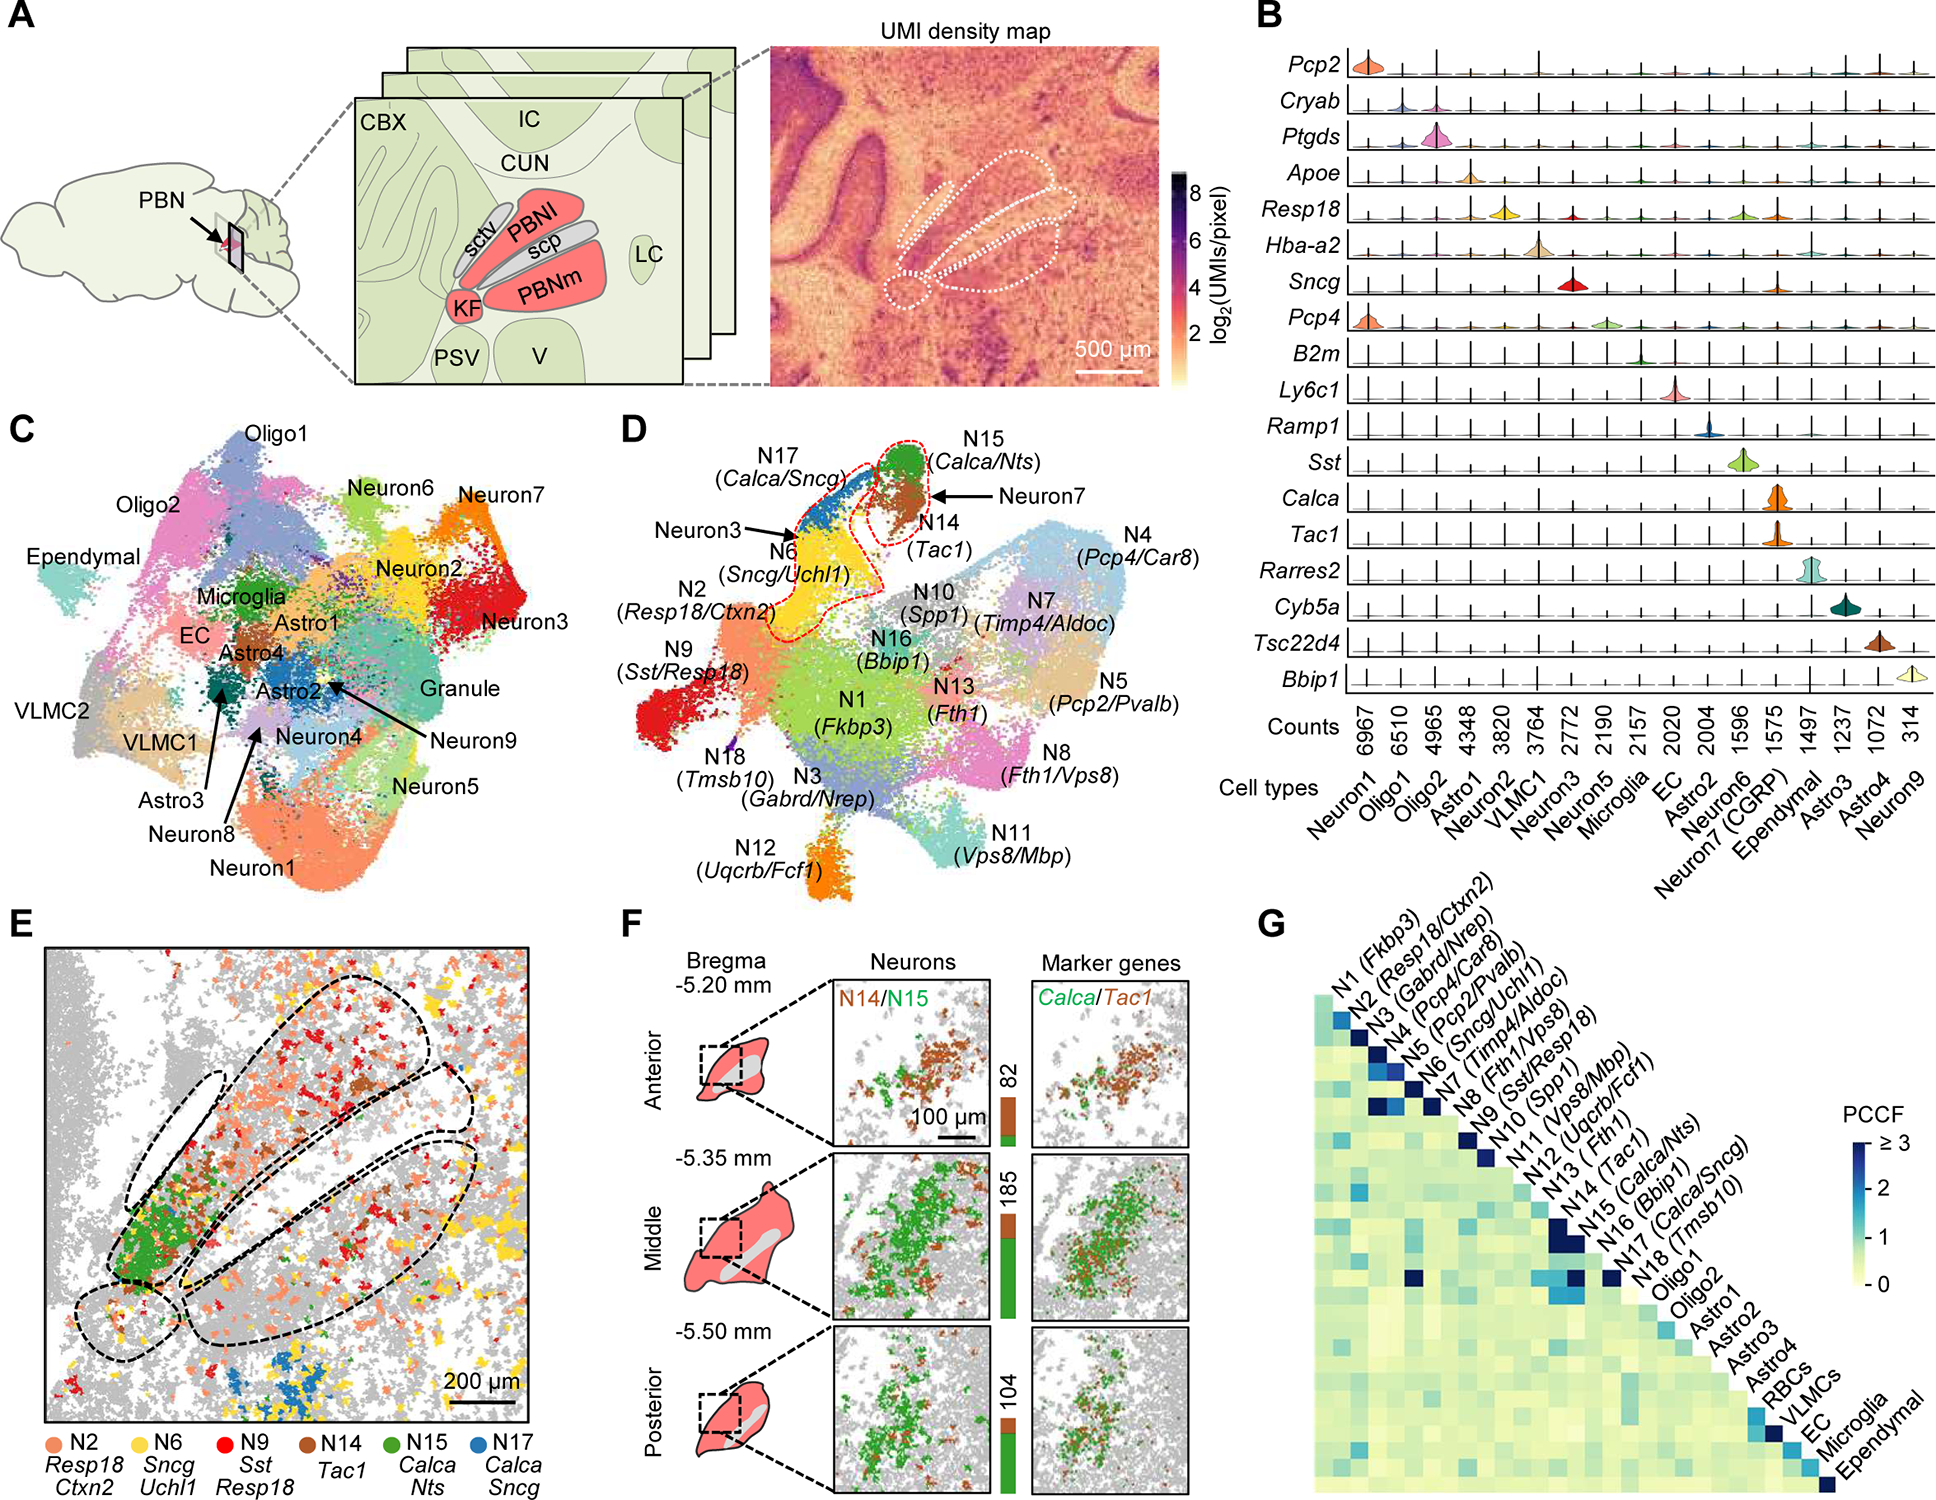
Figure 3. Single-cell spatial transcriptomic mapping of the PBN.

(A) Anatomical structure and UMI density map of a middle coronal section comprising the PBN (red) and neighboring regions. PBNI, lateral PBN; PBNm, medial PBN; KF, Kölliker-Fuse subnucleus; sctv, ventral spinocerebellar tract; scp, superior cerebellar peduncle; CBX, cerebellar cortex; IC, inferior colliculus; CUN, cuneiform nucleus; PSV, principal trigeminal sensory nucleus; V, trigeminal motor nucleus; LC, locus coeruleus.
(B) Violin plots of selected top genes showing differential expression in each cluster.
(C) Uniform Manifold Approximation and Projection (UMAP) clustering of the transcripts segregated into ~60,000 masks from four middle PBN sections passing quality control metrics. Astro, astrocyte; Oligo, oligodendrocyte; EC, endothelial cell; VLMC, vascular and leptomeningeal cell.
(D) UMAP clustering of the data representing 31,505 neuronal cells isolated from (C) with defined marker gene(s) for each cluster. Dotted lines highlight examples of separated subclusters from non-separated clusters in (C).
(E) Spatial distribution of major neuronal subtypes in the PBN and V.
(F) 3D mapping of PBN Tac1 (brown) and Calca (green) neurons. Stacked bars denote cell counts.
(G) Cell-cell contact heatmap of annotated clusters in (C) and (D). Cell contacts were quantified by a PCCF colocalization statistic.
