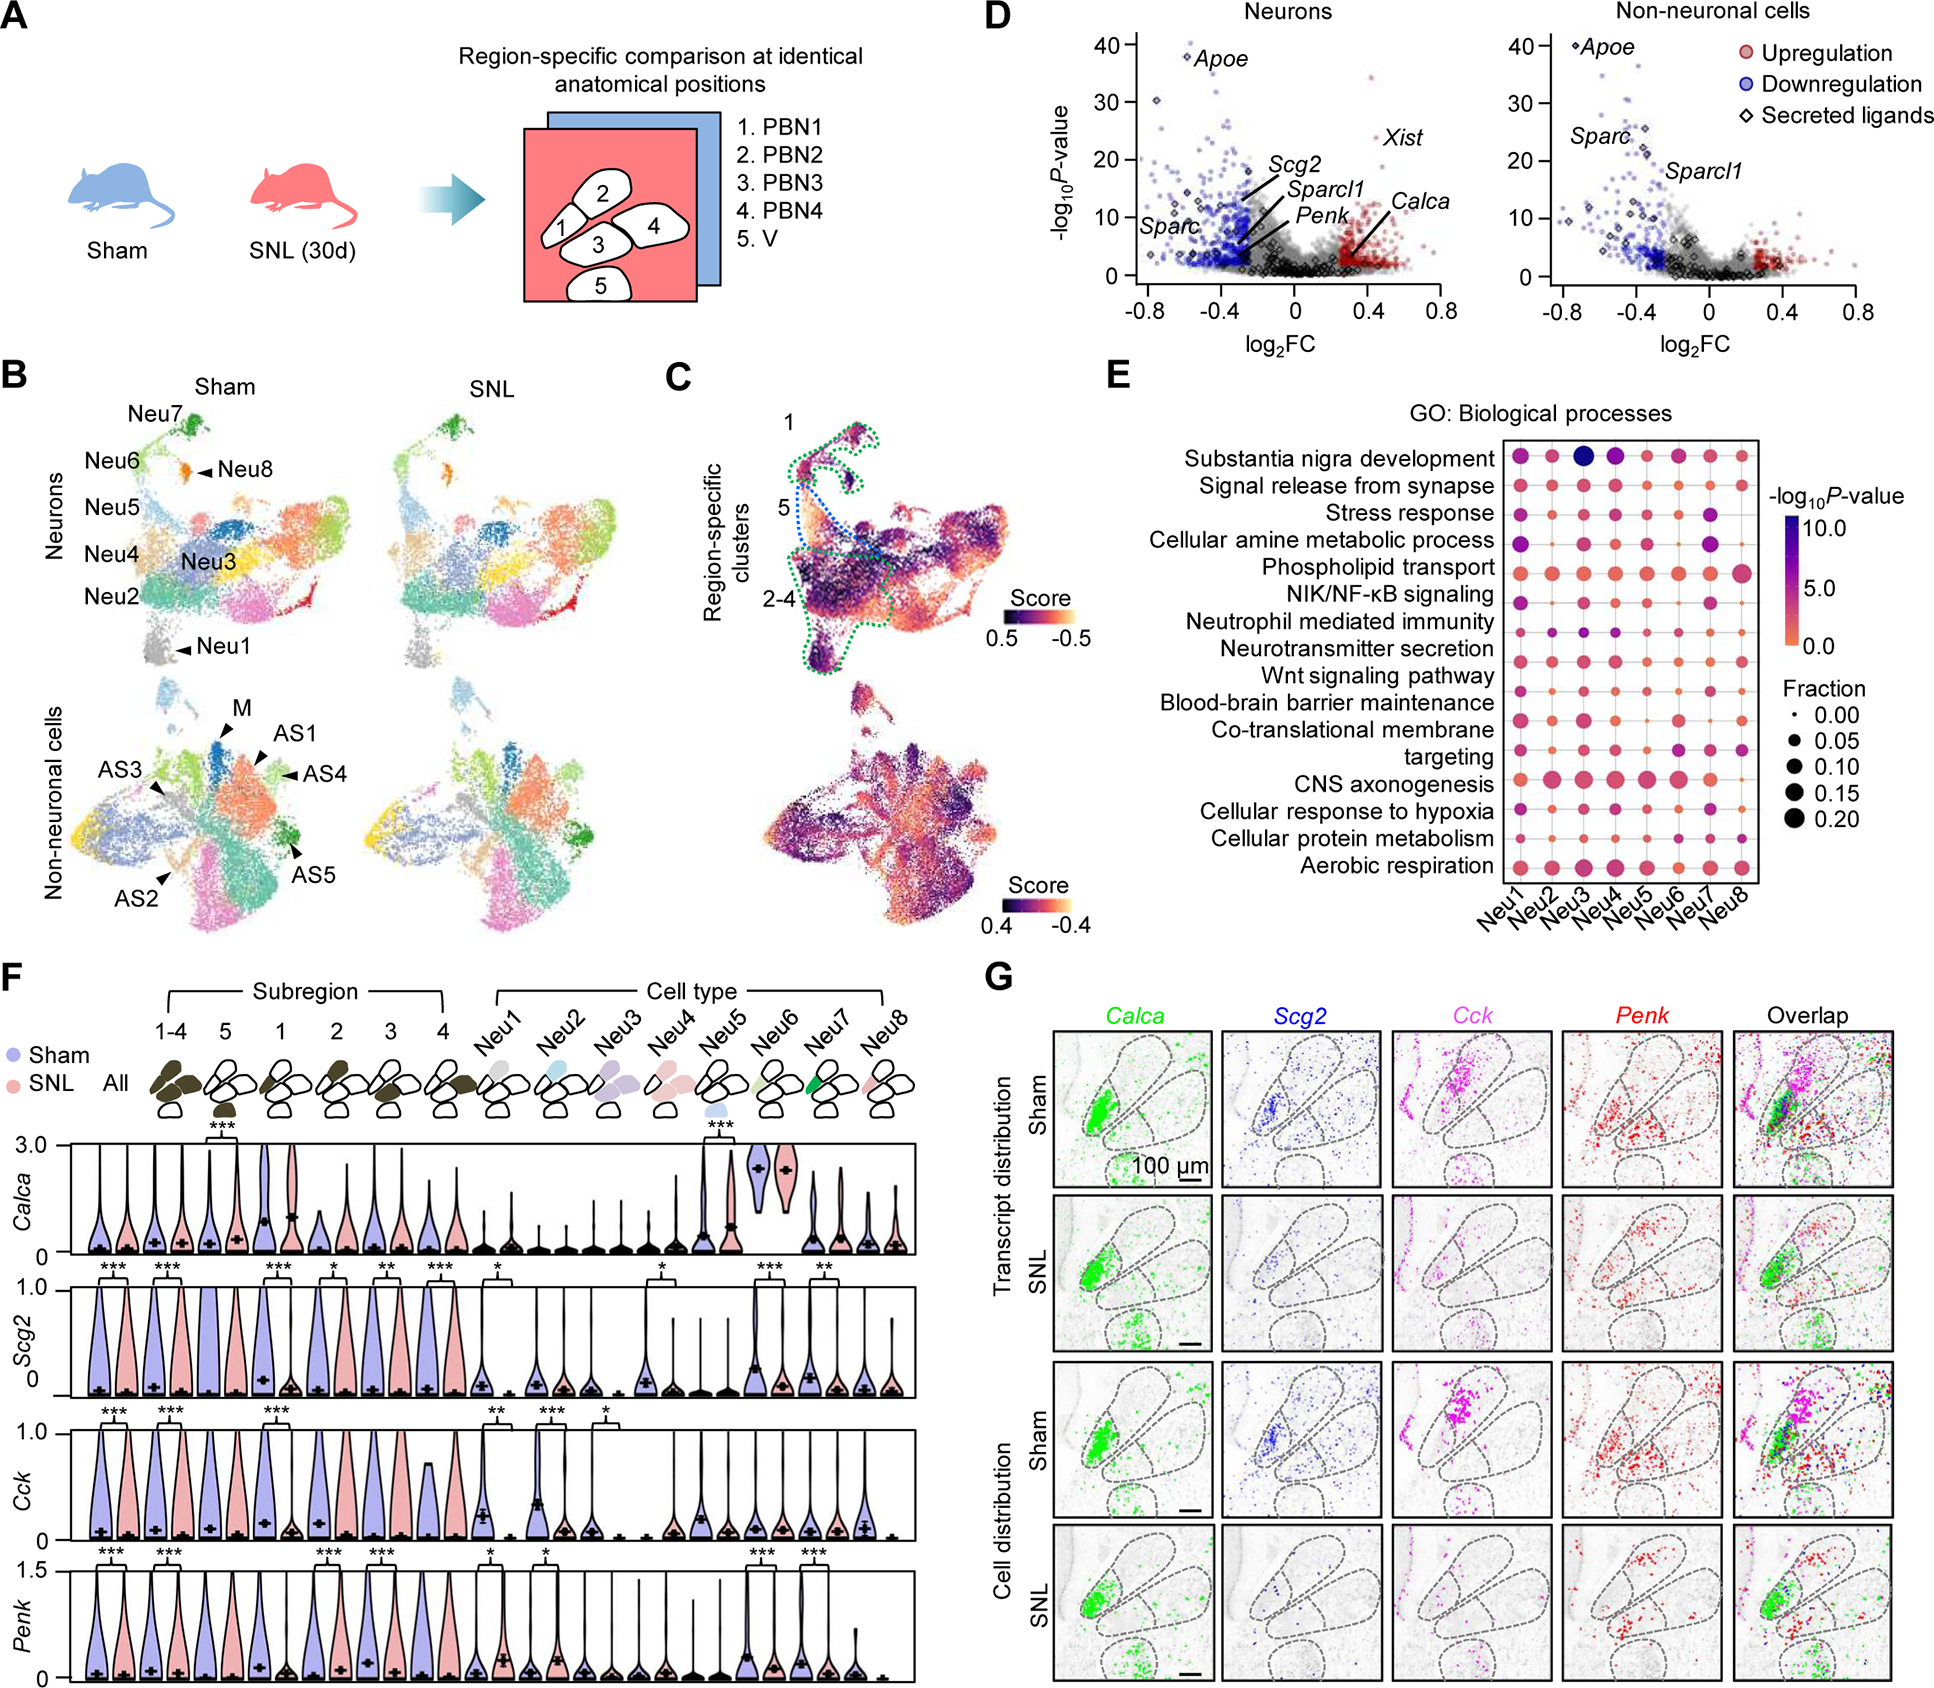
Figure 4. Chronic pain-regulated gene expression in PBN subnuclei.

(A) Comparison of the Pixel-seq data of sham and pain mice at anatomically identical PBN and V subregions. SNL (30d), 30 days post partial sciatic nerve ligation.
(B) UMAP analysis to compare clusters in two middle coronal PBN sections from sham and SNL mice. Segmentation data representing 15,833 neurons and 16,473 non-neuronal cells are plotted. Major neurons, astrocytes, and microglia in the PBN and V are labelled.
(C) Differential abundance analysis of the data in (B). Dotted lines highlight the PBN and V region-specific neuronal clusters.
(D) Differential expression analysis of the data in (B). FC, fold change. Colored genes, |log2FC| ≥ 0.25 and P < 0.05, Wilcoxon rank-sum test. The upregulation of Xist was only found in female mice.
(E) Gene Ontology (GO) enrichment analysis of differentially expressed genes in the major neuronal clusters in the PBN and V. P-values, Fisher’s exact test.
(F) Comparison of region- and cell-type-specific expression of major neuropeptide genes. Data represent mean values of ≥ 217 cells in each group; error bars, standard error of mean. *P < 0.05, **P < 0.01, ***P < 0.001, Wilcoxon rank-sum test.
(G) Comparison of spatial patterns of the neuropeptide genes in (F) and associated cells.
