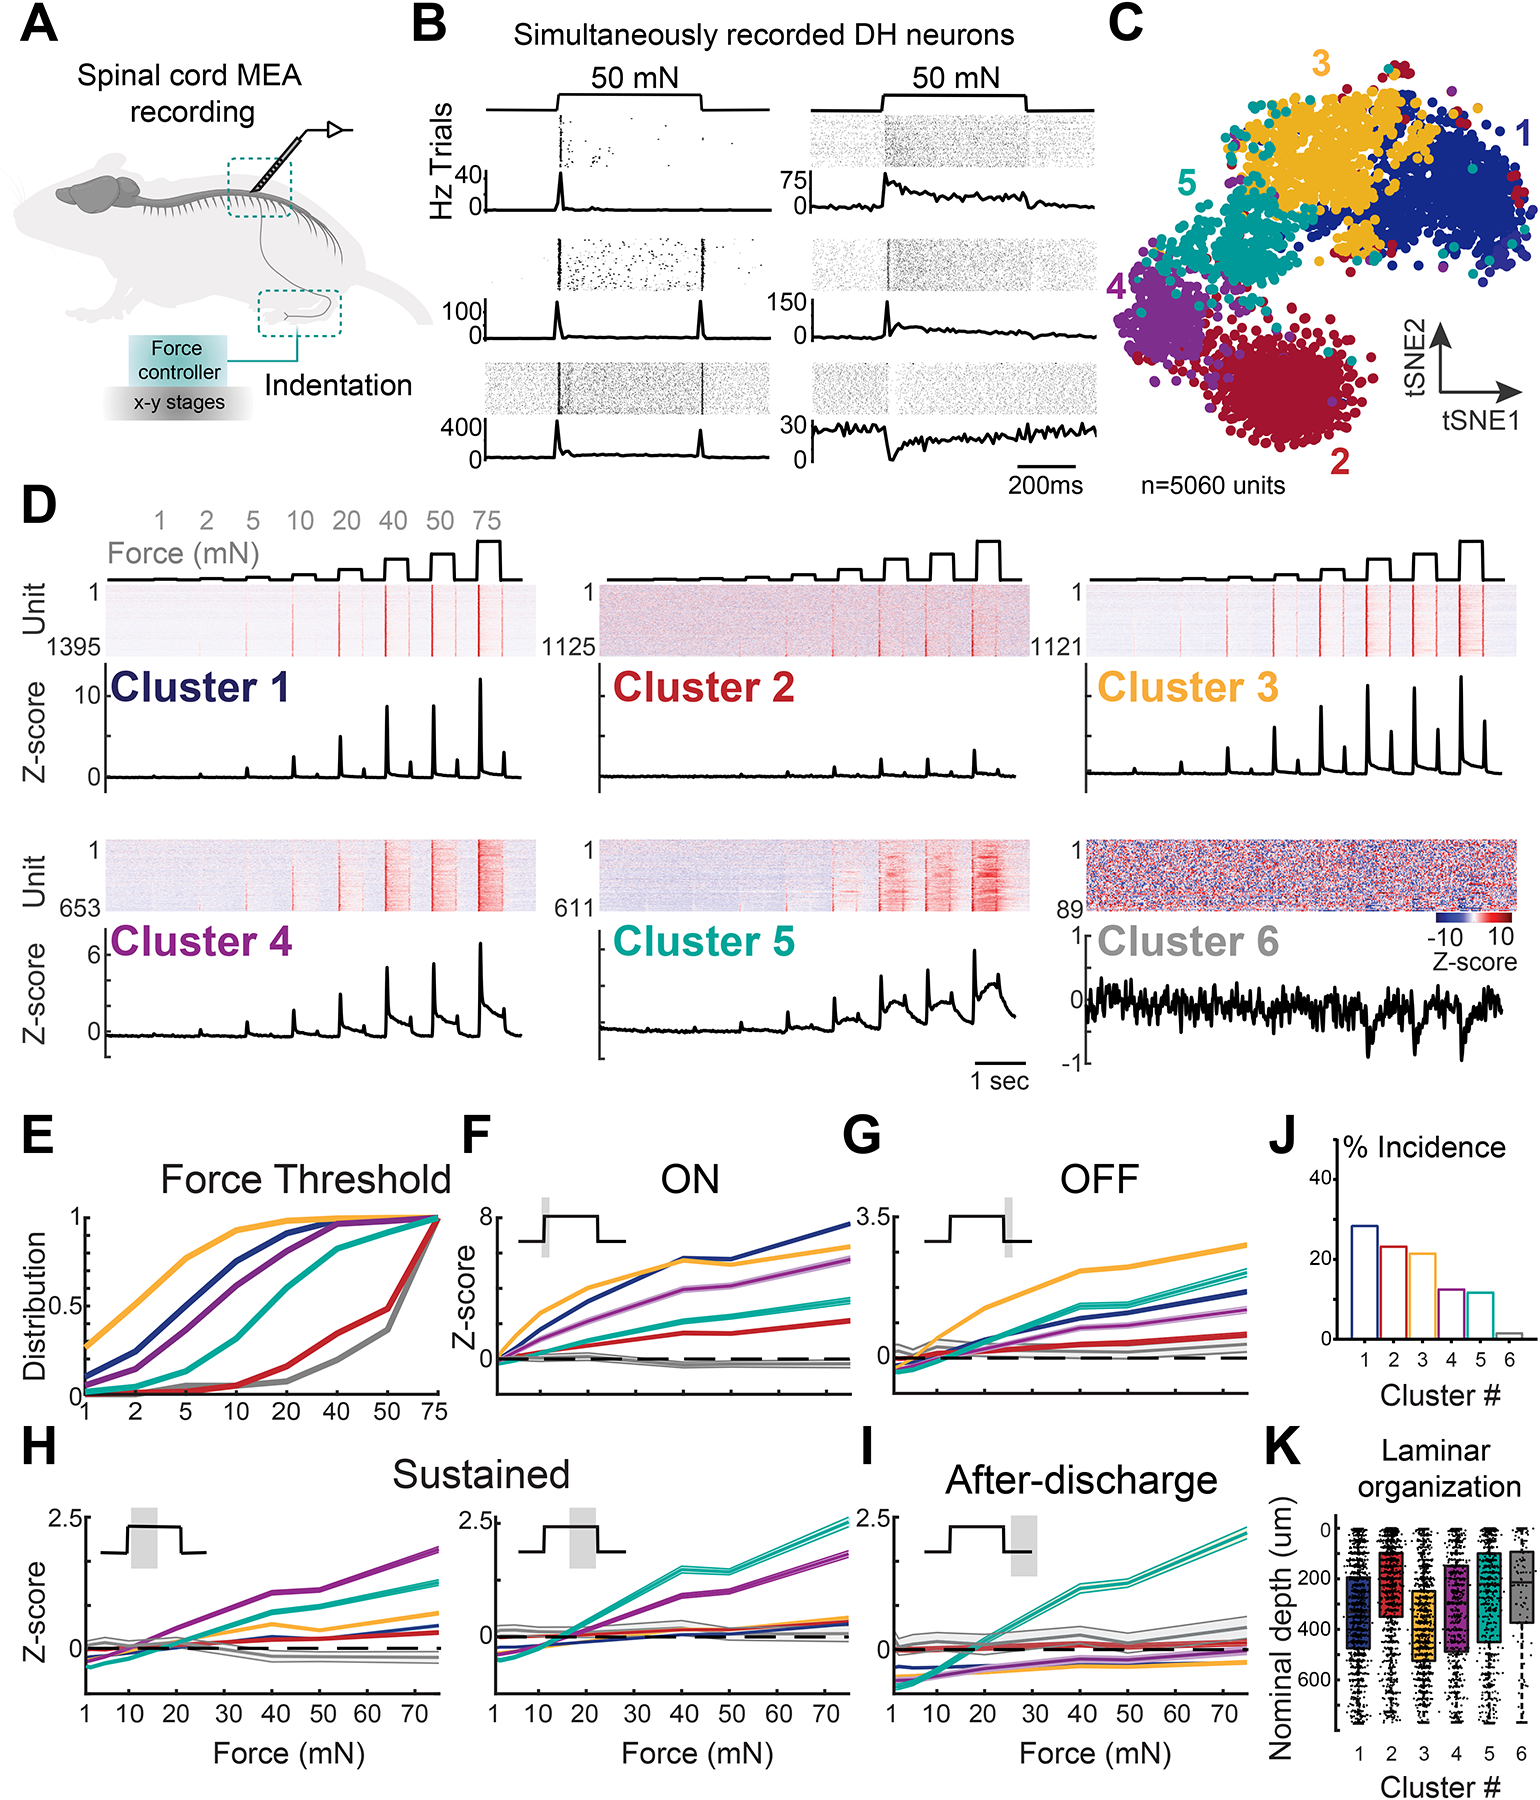
Figure 1. Functional diversity of mechanosensory responses in DH neurons.

A. Experimental configuration.
B. Example raster plots and PSTHs from simultaneously recorded DH neurons during 50 mN step indentations. Top: spike raster; bottom: average PSTH.
C. Functional clusters shown in tSNE.
D. Z-scored firing rates for DH units corresponding to 6 principal functional classes. Top: force traces aligned to the heatmaps of Z-scored firing rates for each functional group. Units are sorted by sensitivity to step indentations. Bottom: average PSTHs for each functional group.
E. Cumulative distribution of response thresholds across functional groups.
F-I. Mean baseline-subtracted firing rates (±SEM) for DH units in each functional group at step indentation onset (ON, 10–50 ms after step onset), offset (OFF; 10–50ms after step offset); sustained (50–250 and 250–500 ms after step onset) and after-discharge (50–250 ms after step offset). See Table S1 for statistical analyses.
J. Percentage incidence for each functional group.
K. Summary boxplots of laminar location for DH units in each functional group.
