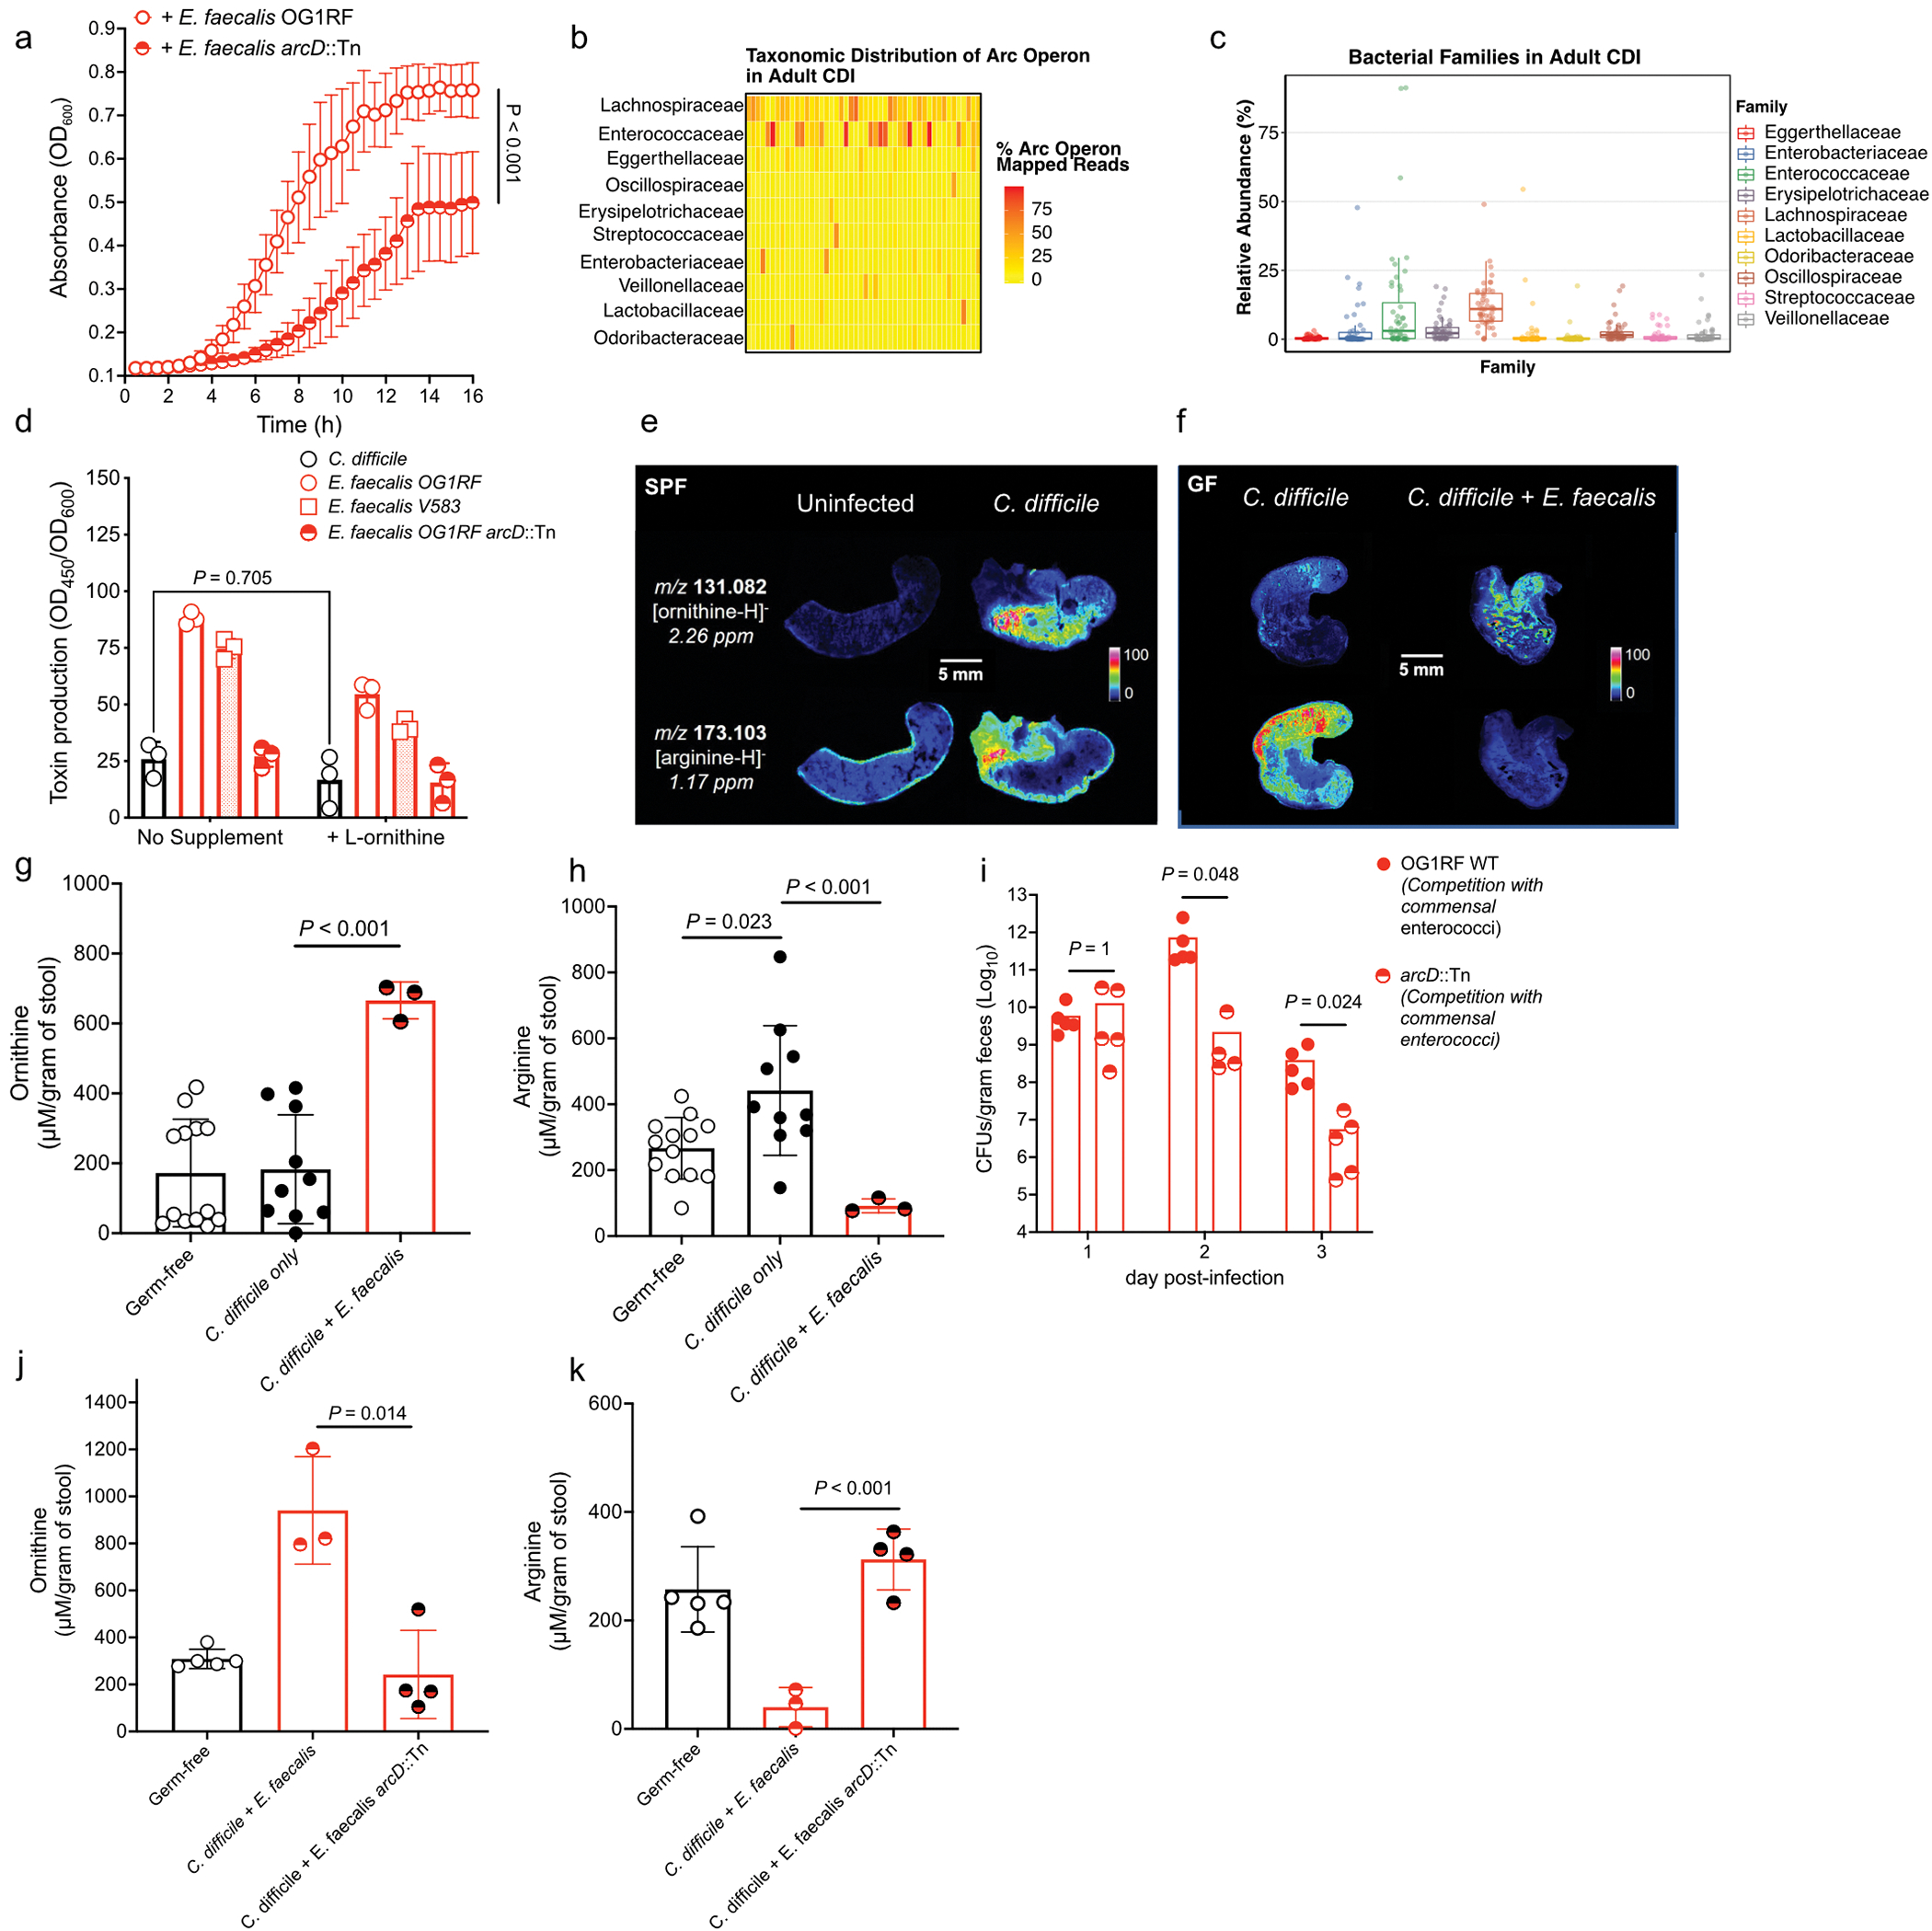
Extended Data Fig. 7. The enterococcal ADI pathway reshapes the metabolic environment in the gut during CDI.

(a) C. difficile growth in presence of E. faecalis or E. faecalis arcD::Tn supernatants. (mean ± s.d., n = 8/group, two-way ANOVA, Time factor P<0.001). (b) Taxonomic distribution (at bacterial family level) of reads mapped to arc genes in adult patients (n=48) with symptomatic CDI. Each column is a subject and each row is a bacterial family. Each cell displays the percentage of reads mapped to arc genes of a specific family out of all arc mapped reads. (c) Relative abundance of the top 10 arc operon containing bacterial families in each adult patient symptomatically infected with C. difficile (n=48, lower and upper hinges correspond to the first (25%) and third (75%) quartiles. The upper and lower whiskers extend from the hinge to the largest value no further than 1.5*IQR. Data beyond the whiskers are plotted individually). (d) Toxin production of C. difficile following introduction of supernatants from E. faecalis and addition of exogenous L-ornithine measured by ELISA (mean ± s.d., n = 3, Tukey’s multiple comparisons test, C. difficile +/− ornithine P=0.705). (e) MALDI-IMS image of uninfected or infected mice (3d post-infection) (SPF) (representative of n = 5 mice) or (f) GF mice mono-infected with C. difficile CD196 or co-infected with E. faecalis OG1RF (2d post-infection) (representative of n = 4 mice). Individual heatmaps of arginine and ornithine. (g) Ornithine levels in stool measured by targeted metabolomics in GF mice infected with C. difficile only (mean ± s.d., n = 10) or C. difficile + E. faecalis OG1RF (mean ± s.d., n = 3, two-sided t-tests with Welch’s correction, P<0.001). Metabolomics were performed on GF mice prior to infection (GF group, n = 13). (h) Arginine levels in stool of GF mice infected with C. difficile only (mean ± s.d., n = 10, two-sided t-test with Welch’s correction, P=0.023) or C. difficile + E. faecalis OG1RF (mean ± s.d., n = 3, two-sided t-test with Welch’s correction, P<0.001). Stool metabolomics performed prior to infection (GF group, n = 13). (i) CFU of E. faecalis OG1RF (wild type) or E. faecalis arcD::Tn during CDI. Each strain introduced prior to CDI and naturally competed with endogenous enterococci (n = 5/group) (mean ± s.e.m. two-sided Mann-Whitney test with Bonferroni-Dunn method for correction for multiple comparisons, day 2 P=0.048, day 3 P=0.024). (j) Ornithine (P=0.014) and (k) arginine (P<0.001) levels in stool measured by targeted metabolomics in GF mice infected with C. difficile. Mice pre-colonized for 1 day with E. faecalis (n = 3) or E. faecalis arcD::Tn (n = 4) (mean ± s.d.. two-sided t-tests with Welch’s correction). Metabolomics performed on GF mice prior to infection (GF group, n = 5).
