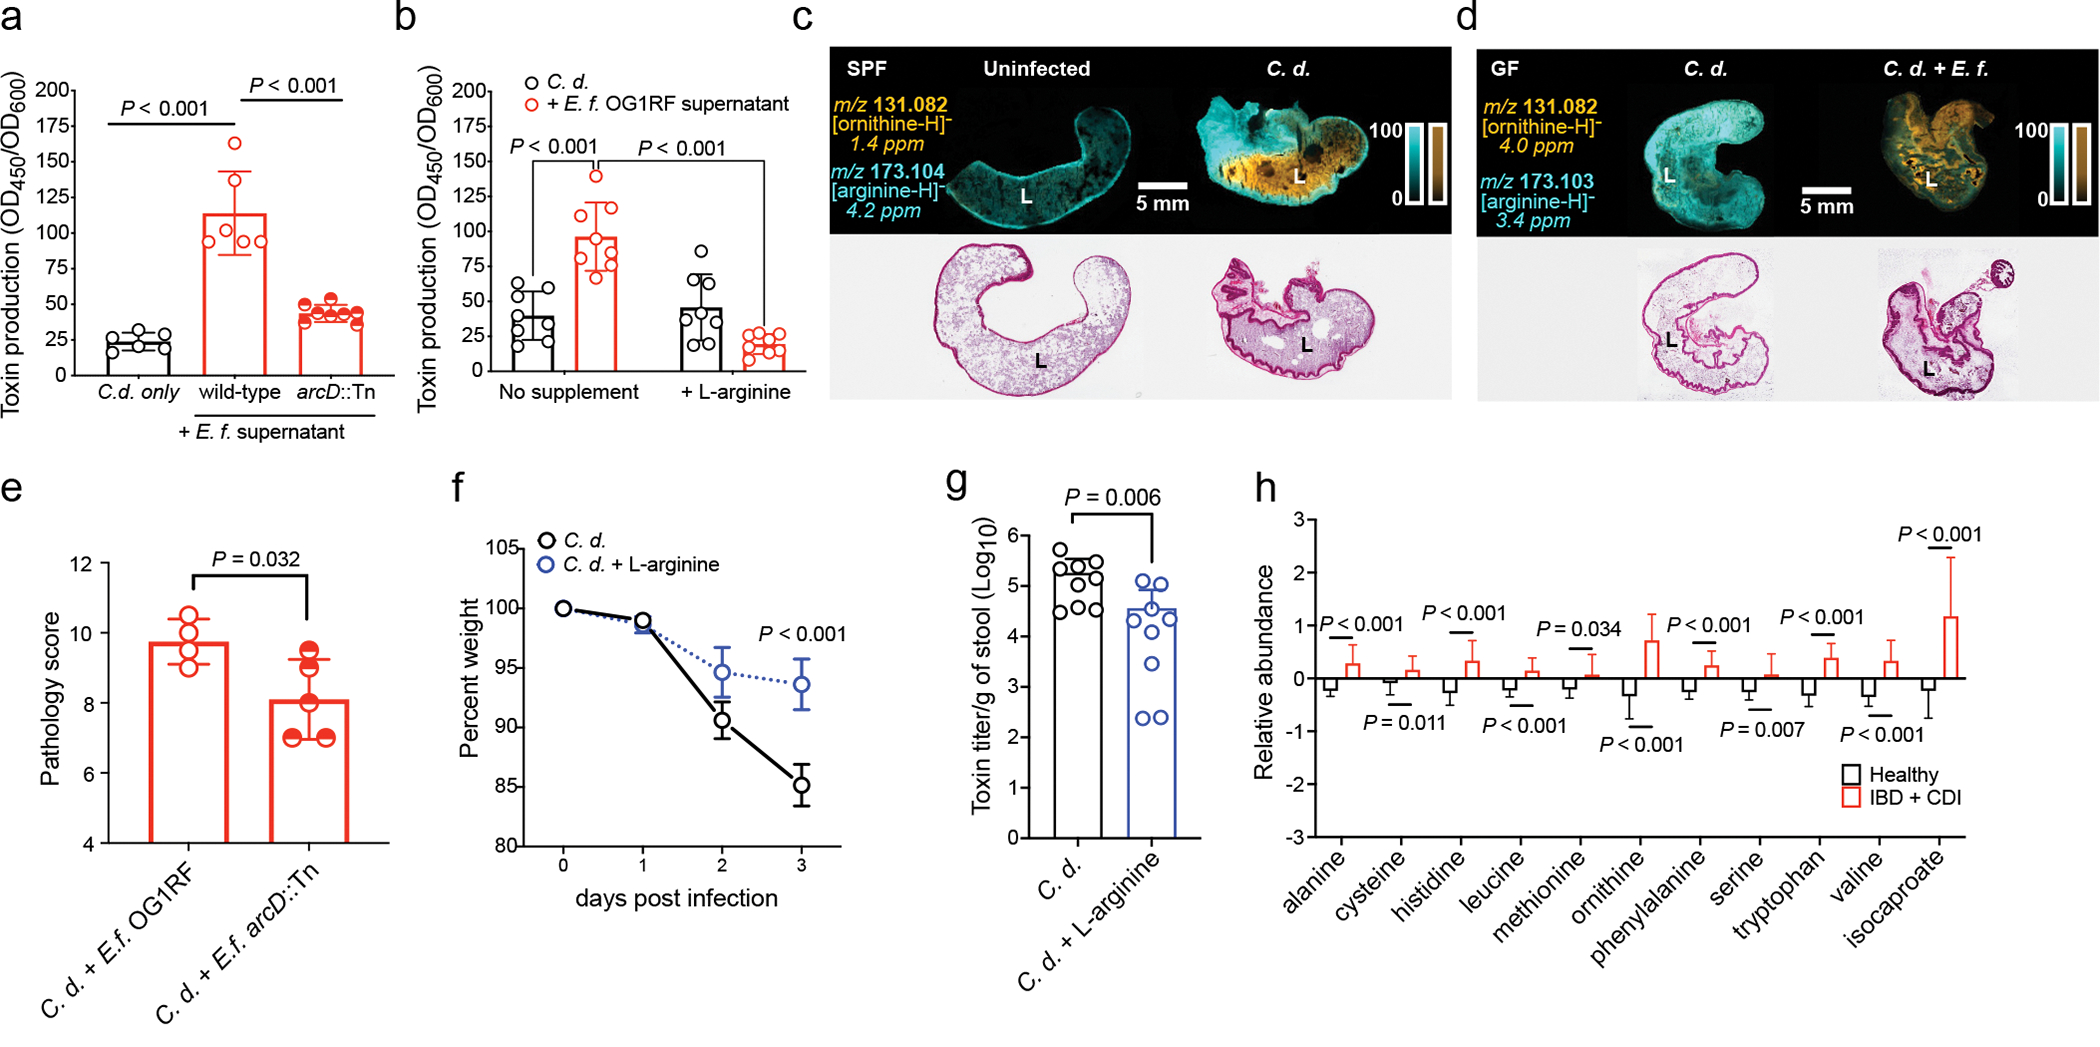
Fig. 4. E. faecalis ADI pathway enhances C. difficile virulence.

(a) C. difficile CD196 toxin production measured by ELISA (mean ± s.d., n = 6 C. d. only and OG1RF supernatant, n=8 arcD::Tn, two-sided t-tests with Welch’s correction) and (b) supplementation with L-arginine (mean ± s.d., n = 8/group, Tukey’s multiple comparison test) (C.d. = C. difficile; E.f. = E. faecalis). Corrected P values in Supplementary Table 5. (c) MALDI-IMS image of ornithine and arginine in uninfected or infected mice (3 d post-infection) (SPF) (representative of n = 5 mice) or (d) GF mice mono-infected with C. difficile CD196 or co-infected with E. faecalis OG1RF (2d post-infection) (GF) (representative of n = 4 mice). Corresponding hematoxylin and eosin stained tissue displayed. “L” = lumen. (e) Pathology score from cecum of GF mice pre-colonized with E. faecalis OG1RF (n = 4) or E. faecalis arcD::Tn (n = 5) and subsequently infected with C. difficile (mean ± s.d., two-sided t-tests with Welch’s correction, P=0.032). (f) Percent weight of mice infected with C. difficile CD196 and treated with 2% L-arginine in drinking water (mean ± s.d., n = 9/treatment group, two-way ANOVA with Bonferroni’s multiple comparison test, day 3 P<0.001). (g) C. difficile toxin titers from mice infected with C. difficile and treated with 2% L-arginine in their drinking water (mean ± s.d., n = 9/treatment group, two-sided Mann-Whitney test, P=0.006). Stool toxin titers measured by cytotoxicity. (h) Relative abundance of select amino acids and isocaproate in feces of pediatric patients with IBD and CDI (mean ± s.d., n = 20) or healthy controls (mean ± s.d., n = 19, multiple two-sided t-tests with Bonferroni-Dunn method for correction for multiple comparisons. Corrected P values in Supplementary Table 5). Metabolites shown as relative values with each value rescaled to set the median value to 1.
