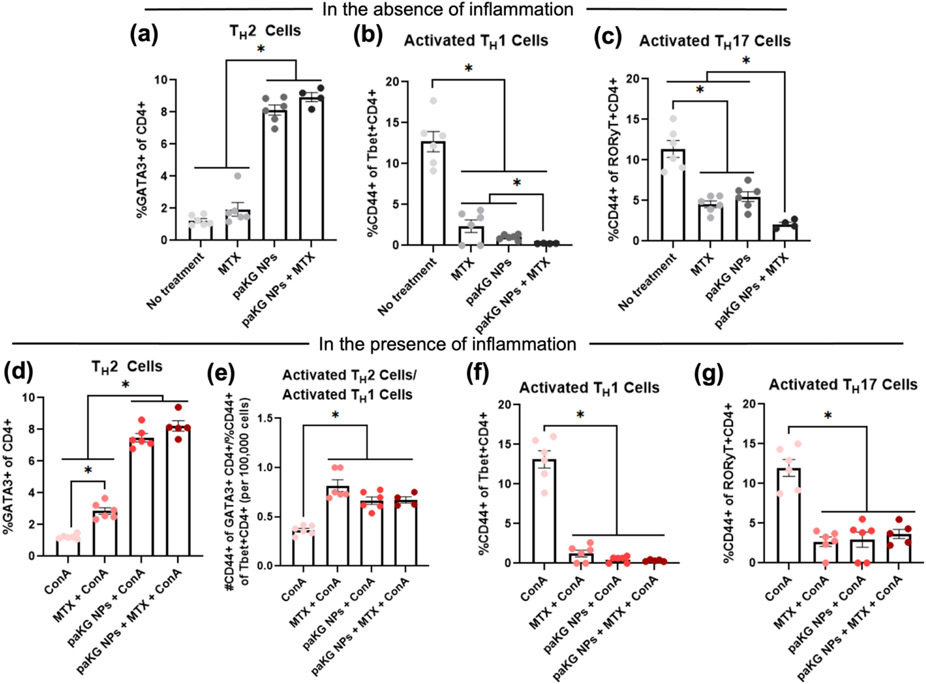
Figure 2: In vitro cellular responses to paKG NPs + MTX.
(a-h) Flow cytometry of in vitro splenic T cell responses treated with a final well concentration of 1 mg/mL of methotrexate and/or 0.1 mg/mL of paKG nanoparticles and cultured in 37°C for 48-72 hrs (negative control = No treatment), (a-c) in the absence and, (d-g) presence of a final well concentration of 2.5 μg/mL of Concanavalin A (ConA – used to mimic inflammation in vitro) (n = 4-6; avg ± SEM; * = p ≤ 0.05; One-Way ANOVA, Brown-Forsythe and Welch ANOVA tests, unpaired t with Welch’s correction).

