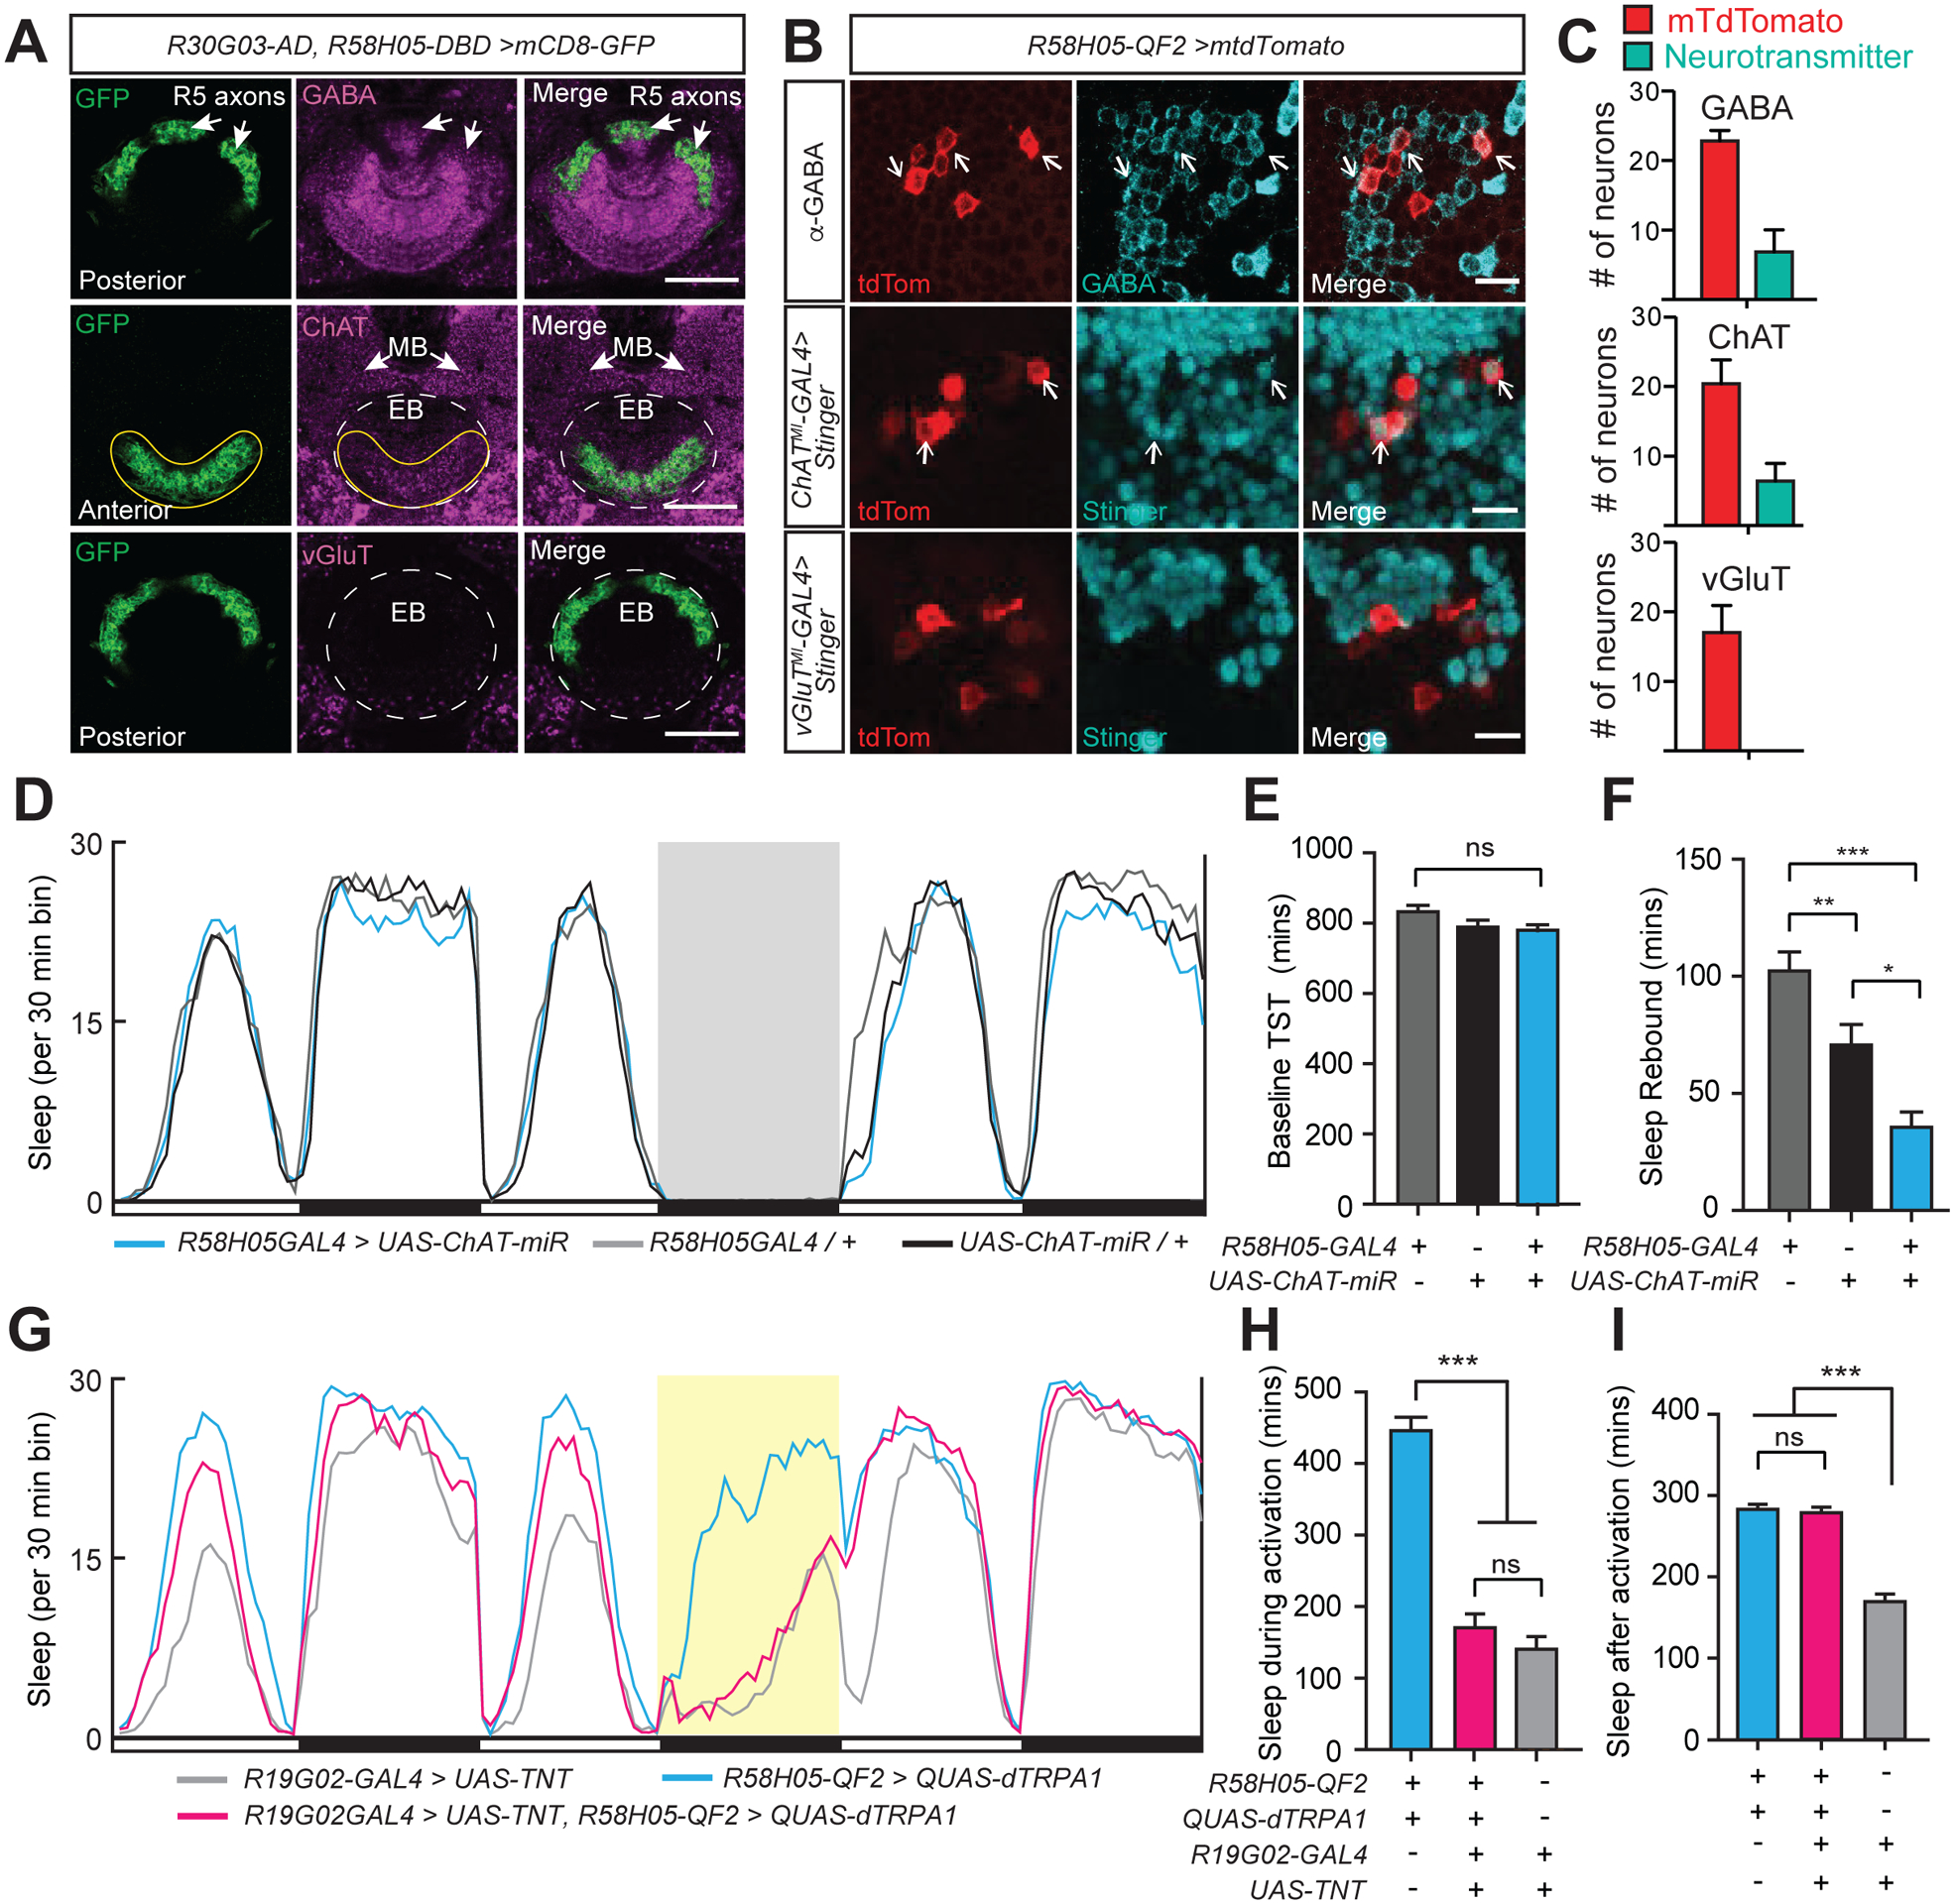
Figure 3. R5 neurons act upstream of EPG neurons to promote sleep.

(A) Neurotransmitter staining of R5 ring neurons in an R30G03-AD, R58H05-DBD>UAS-mCD8::GFP animal. Whole-mount brain immunostaining showing anti-GFP (green), either anti-GABA, anti-ChAT, or anti-VGluT (magenta), and merged signals. Top row, posterior aspect, arrows indicate co-localization of R5 axons with GABA signal. Middle row, anterior aspect, ChAT staining colocalization with GFP signal is indicated (yellow solid line), while the location of EB ring is shown with white dashed lines. Arrows point to mushroom body (MB) lobes. Bottom, posterior aspect, no detectable overlap between vGLUT expression and GFP. EB ring is outlined with white dashed lines. Scale bars indicate 20 μm.
(B) Co-staining of R5 neurons and neurotransmitter-labeled cell bodies. R5 neurons are labeled with R58H05-QF2-7>mtdTomato (anti-dsRed, red). Neurotransmitter expression of cell bodies is labeled either by anti-GABA (top row) antibody (anti-GABA, green) or MIMIC line insertions for ChAT (middle row, ChATMI-GAL4>Stinger) or vGluT (bottom row, vGluTMI-GAL4>Stinger) driving Stinger (anti-GFP, green) expression. Arrows indicate R5 cell bodies which show co-labeling with neurotransmitter. Representative images are shown. Scale bar indicates 10 μm.
(C) Neuronal cell counts of R5 neurons and co-labeling with GABA, ChAT, and vGluT. In R58H05-QF2-7>mtdTomato animals stained with anti-GABA (n=6), an average of 6.8 out of 22.8 R5 neurons per brain were co-stained with GABA. For R58H05-QF2-7>mtdTomato animals with ChATMI-GAL4>Stinger (n=8), an average of 6.4 out of 20.4 R5 neurons per brain were cholinergic. No R5 neurons in R58H05-QF2-7>mtdTomato, vGluTMI-GAL4>Stinger animals (n=8) were observed to have vGluT co-labeling. Mean ±SEM is shown. These data are quantified from imaging experiments in Figure 3B.
(D) Sleep profiles of R58H05-GAL4>UAS-ChAT-miR (blue), R58H05GAL4>iso31 (gray), and iso31>UAS-ChAT-mir (black) flies. Sleep time plotted in 30 min bins. White and black bars indicate 12 hr light and dark periods, respectively. The period of sleep deprivation via mechanical shaking is indicated with a gray background. Data are from same flies as in (E) and (F).
(E and F) Baseline total sleep time (TST) (E) and rebound sleep from ZT0-6 (F) for R58H05GAL4>iso31 (n=64), iso31>UAS-ChAT-miR (n=60), and R58H05-GAL4>UAS-ChAT-miR (n=60). Mean ± SEM is shown; one way ANOVA with Tukey’s post hoc test.
(G) Sleep profiles of R58H05-QF2-A>QUAS-dTRPA1; R19G02-GAL4>UAS-TNT (magenta), R19G02-GAL4>UAS-TNT (gray), and R58H05-QF2-A>QUAS-dTRPA1 (blue) flies. Sleep time plotted in 30 min bins. White and black bars indicate 12 hr light and dark periods, respectively. The period of dTRPA1 activation at 29°C from ZT12-24 is indicated with a yellow background. Data are from same flies as in (H) and (I).
(H and I) Sleep during (H) and after (I, ZT0-6) dTRPA1 activation for R58H05-QF2-A>QUAS-dTRPA1 (n=48), R58H05-QF2-A>QUAS-dTRPA1; R19G02-GAL4>UAS-TNT (n=53), and R19G02-GAL4>UAS-TNT (n=56) flies. Mean ± SEM is shown; one way ANOVA with Tukey’s post hoc test. See also Figure S3.
