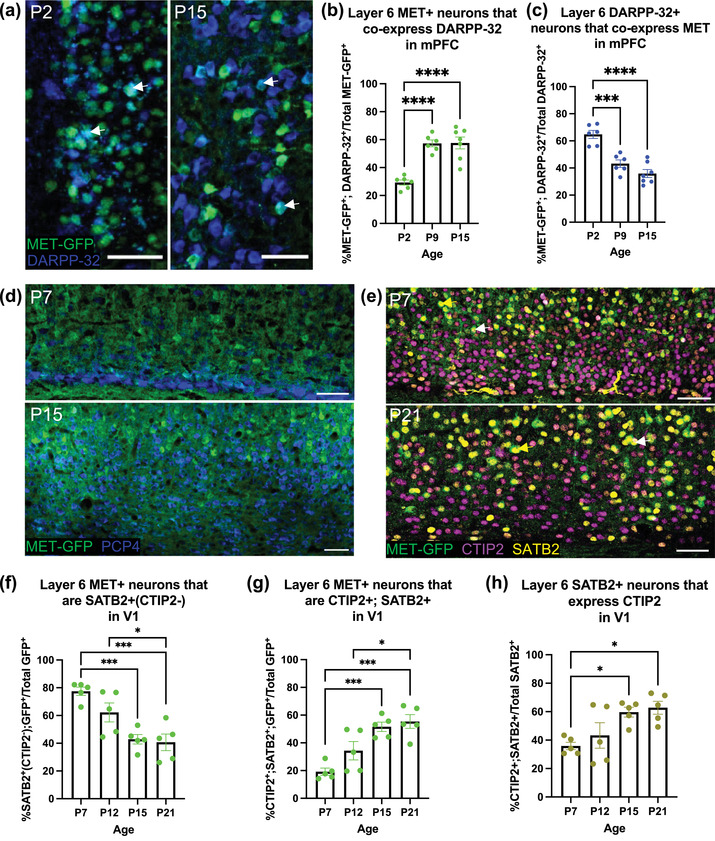
FIGURE 4.

Colocalization analysis of MET‐GFP with layer 6 projection neuron markers, in mPFC and V1 across developmental ages. (a) Representative images at P2 (left panel) and P15 (right panel) of MET‐GFP (green) and DARPP‐32 (blue) overlayed expressions in layer 6 mPFC. Arrows denote examples of colocalization between MET‐GFP and DARPP‐32. (b) Quantification of the percentage of layer 6 mPFC MET‐GFP+ neurons that co‐express DARPP‐32 at P2, P9, and P15. n = 6 for P2 and P9, n = 7 for P15. “****” indicates p < .0001, analyzed by ordinary one‐way ANOVA followed by Tukey's multiple comparisons test. (c) Quantification of the percentage of layer 6 mPFC DARPP‐32+ neurons that co‐express MET‐GFP at P2, P9, and P15. n = 6 for P2 and P9, n = 7 for P15. “***” indicates p < .001, “****” indicates p < .0001, analyzed by ordinary one‐way ANOVA followed by Tukey's multiple comparisons test. (d) Representative images at P7 (top panel) and P15 (bottom panel) of MET‐GFP (green) and PCP4 (blue) overlayed expressions in layer 6 V1. (e) Representative images at P7 (top panel) and P21 (bottom panel) of MET‐GFP (green), CTIP2 (magenta), and SATB2 (yellow) overlayed expressions in layer 6 V1. White arrows denote examples of colocalization between MET‐GFP, CTIP2, and SATB2. Magenta arrows denote examples of MET‐GFP+; CTIP2+(SATB2−) neurons. (f) Quantification of the percentage of layer 6 V1 MET‐GFP+ neurons that are SATB2+(CTIP2−) at P7, P12, P15, and P21. n = 5 for each age. “*” indicates p ≤ .05, “***” indicates p < .001, analyzed by ordinary one‐way ANOVA followed by Tukey's multiple comparisons test. (g) Quantification of the percentage of layer 6 V1 MET‐GFP+ neurons that co‐express both CTIP2 and SATB2 at P7, P12, P15, and P21. n = 5 for each age. “*” indicates p ≤ .05, “***” indicates p < .001, analyzed by ordinary one‐way ANOVA followed by Tukey's multiple comparisons test. (h) Quantification of the percentage of layer 6 V1 SATB2+ neurons that express CTIP2 at P7, P12, P15, and P21. n = 5 for each age. “*” indicates p ≤ .05, analyzed by ordinary one‐way ANOVA followed by Tukey's multiple comparisons test. All scale bars = 50 µm. The brightness and contrast of each channel were increased globally in images for visualization purposes.
