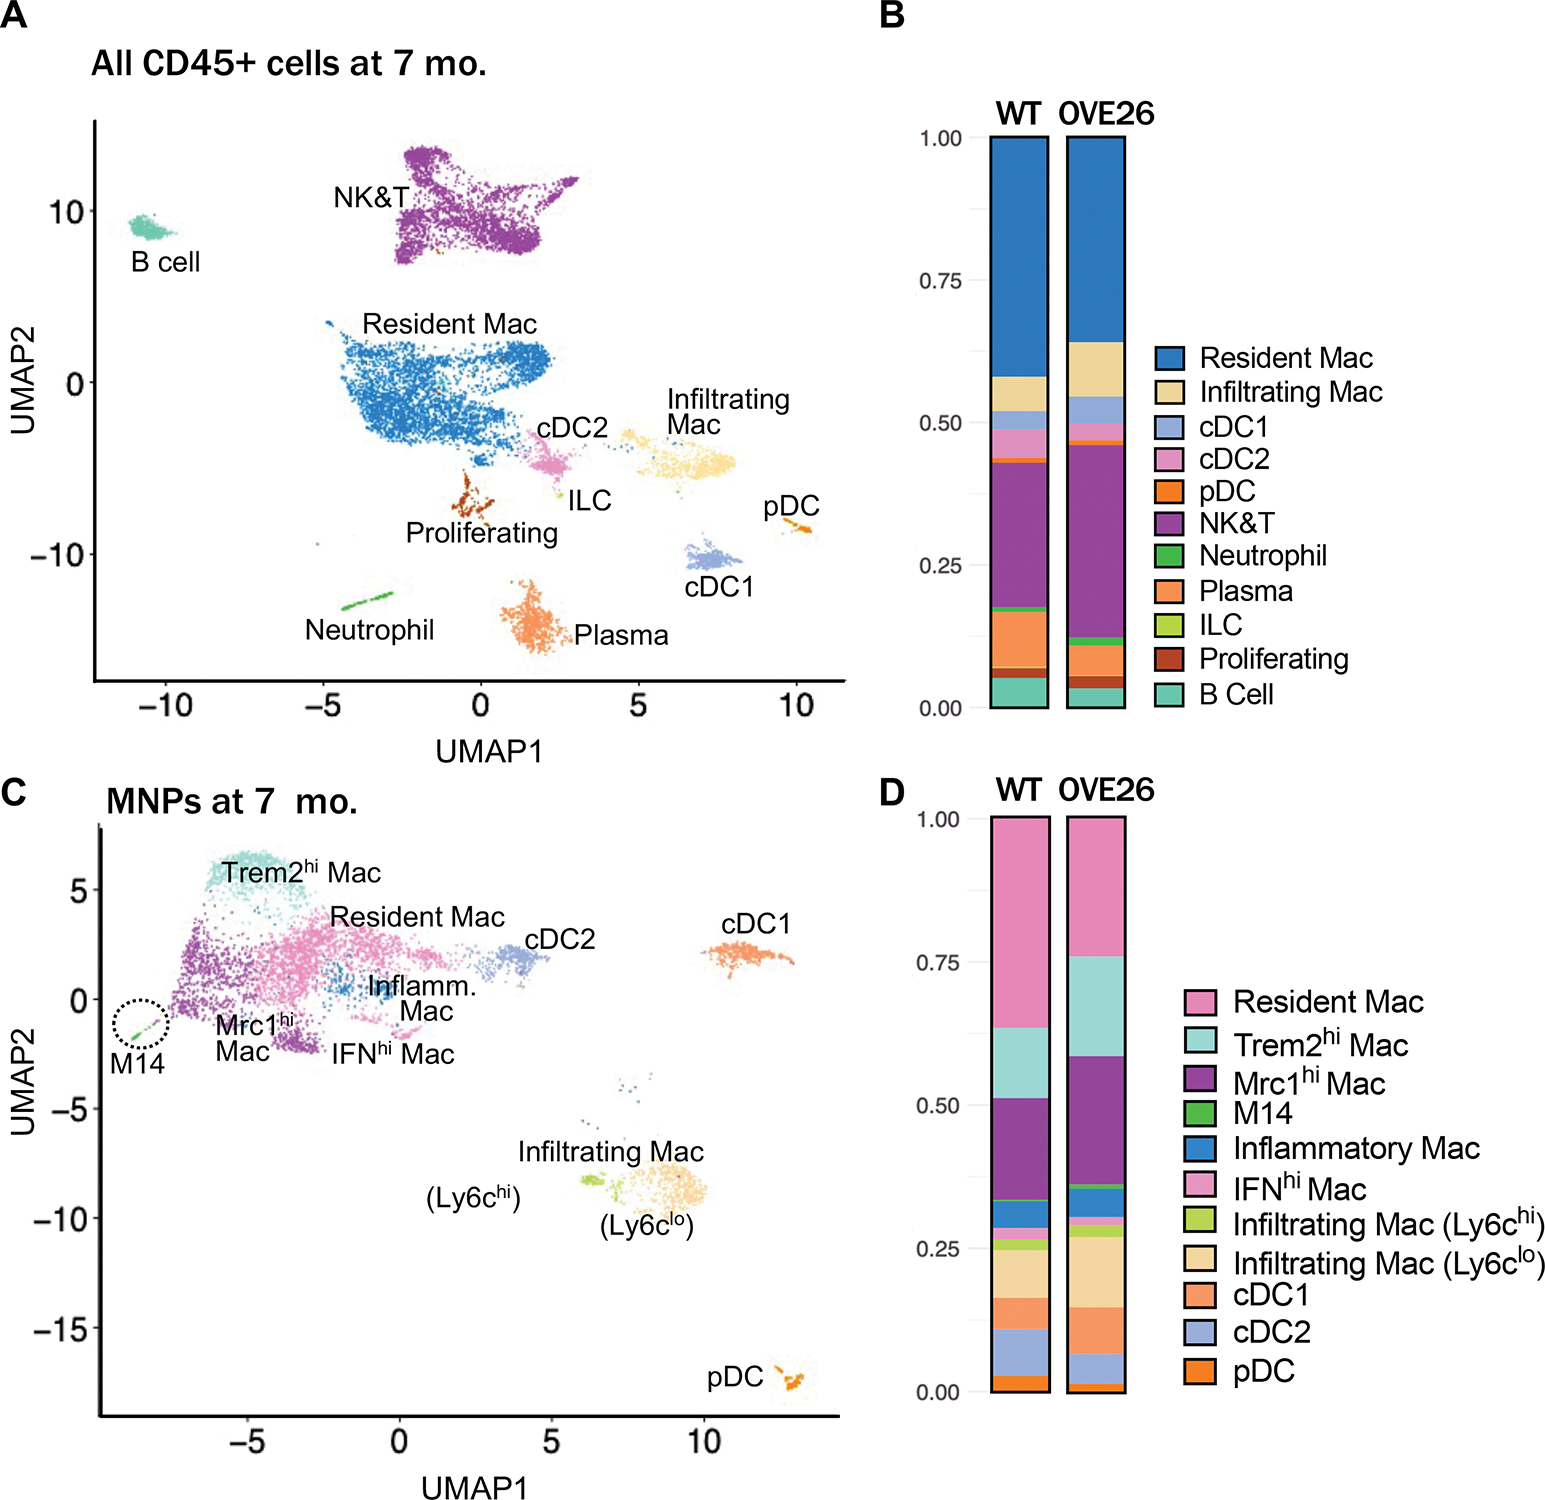
Figure 2: Analysis of mononuclear phagocyte (MNP) cell subpopulations in 7-months-old OVE26 mice.

(A) Uniform manifold approximation and projection (UMAP) of CD45+ cells from 7-month-old WT and OVE26 mouse kidneys. (B) Proportions of CD45+ immune cell subtypes in 7-month-old WT and OVE26 kidneys are shown as a bar graph. (D) UMAP plot of MNPs from 7-month-old WT and OVE26 mouse kidneys. (E) Proportions of each MNP subclusters in 7-month-old WT and OVE26 kidneys. DC, dentritic cell; Mac, macrophage; cDC, conventional DC; pDC, plasmacytoid DC; ILCs, innate lymphoid cells; NK&T, natural killer and T cells; IFNhi, interferon (IFN)-induced gene expression-high; Mrc1hi, Mannose receptor C-type 1 expression-high; Trem2hi, triggered receptor expressed on myeloid cells 2 expression-high.
