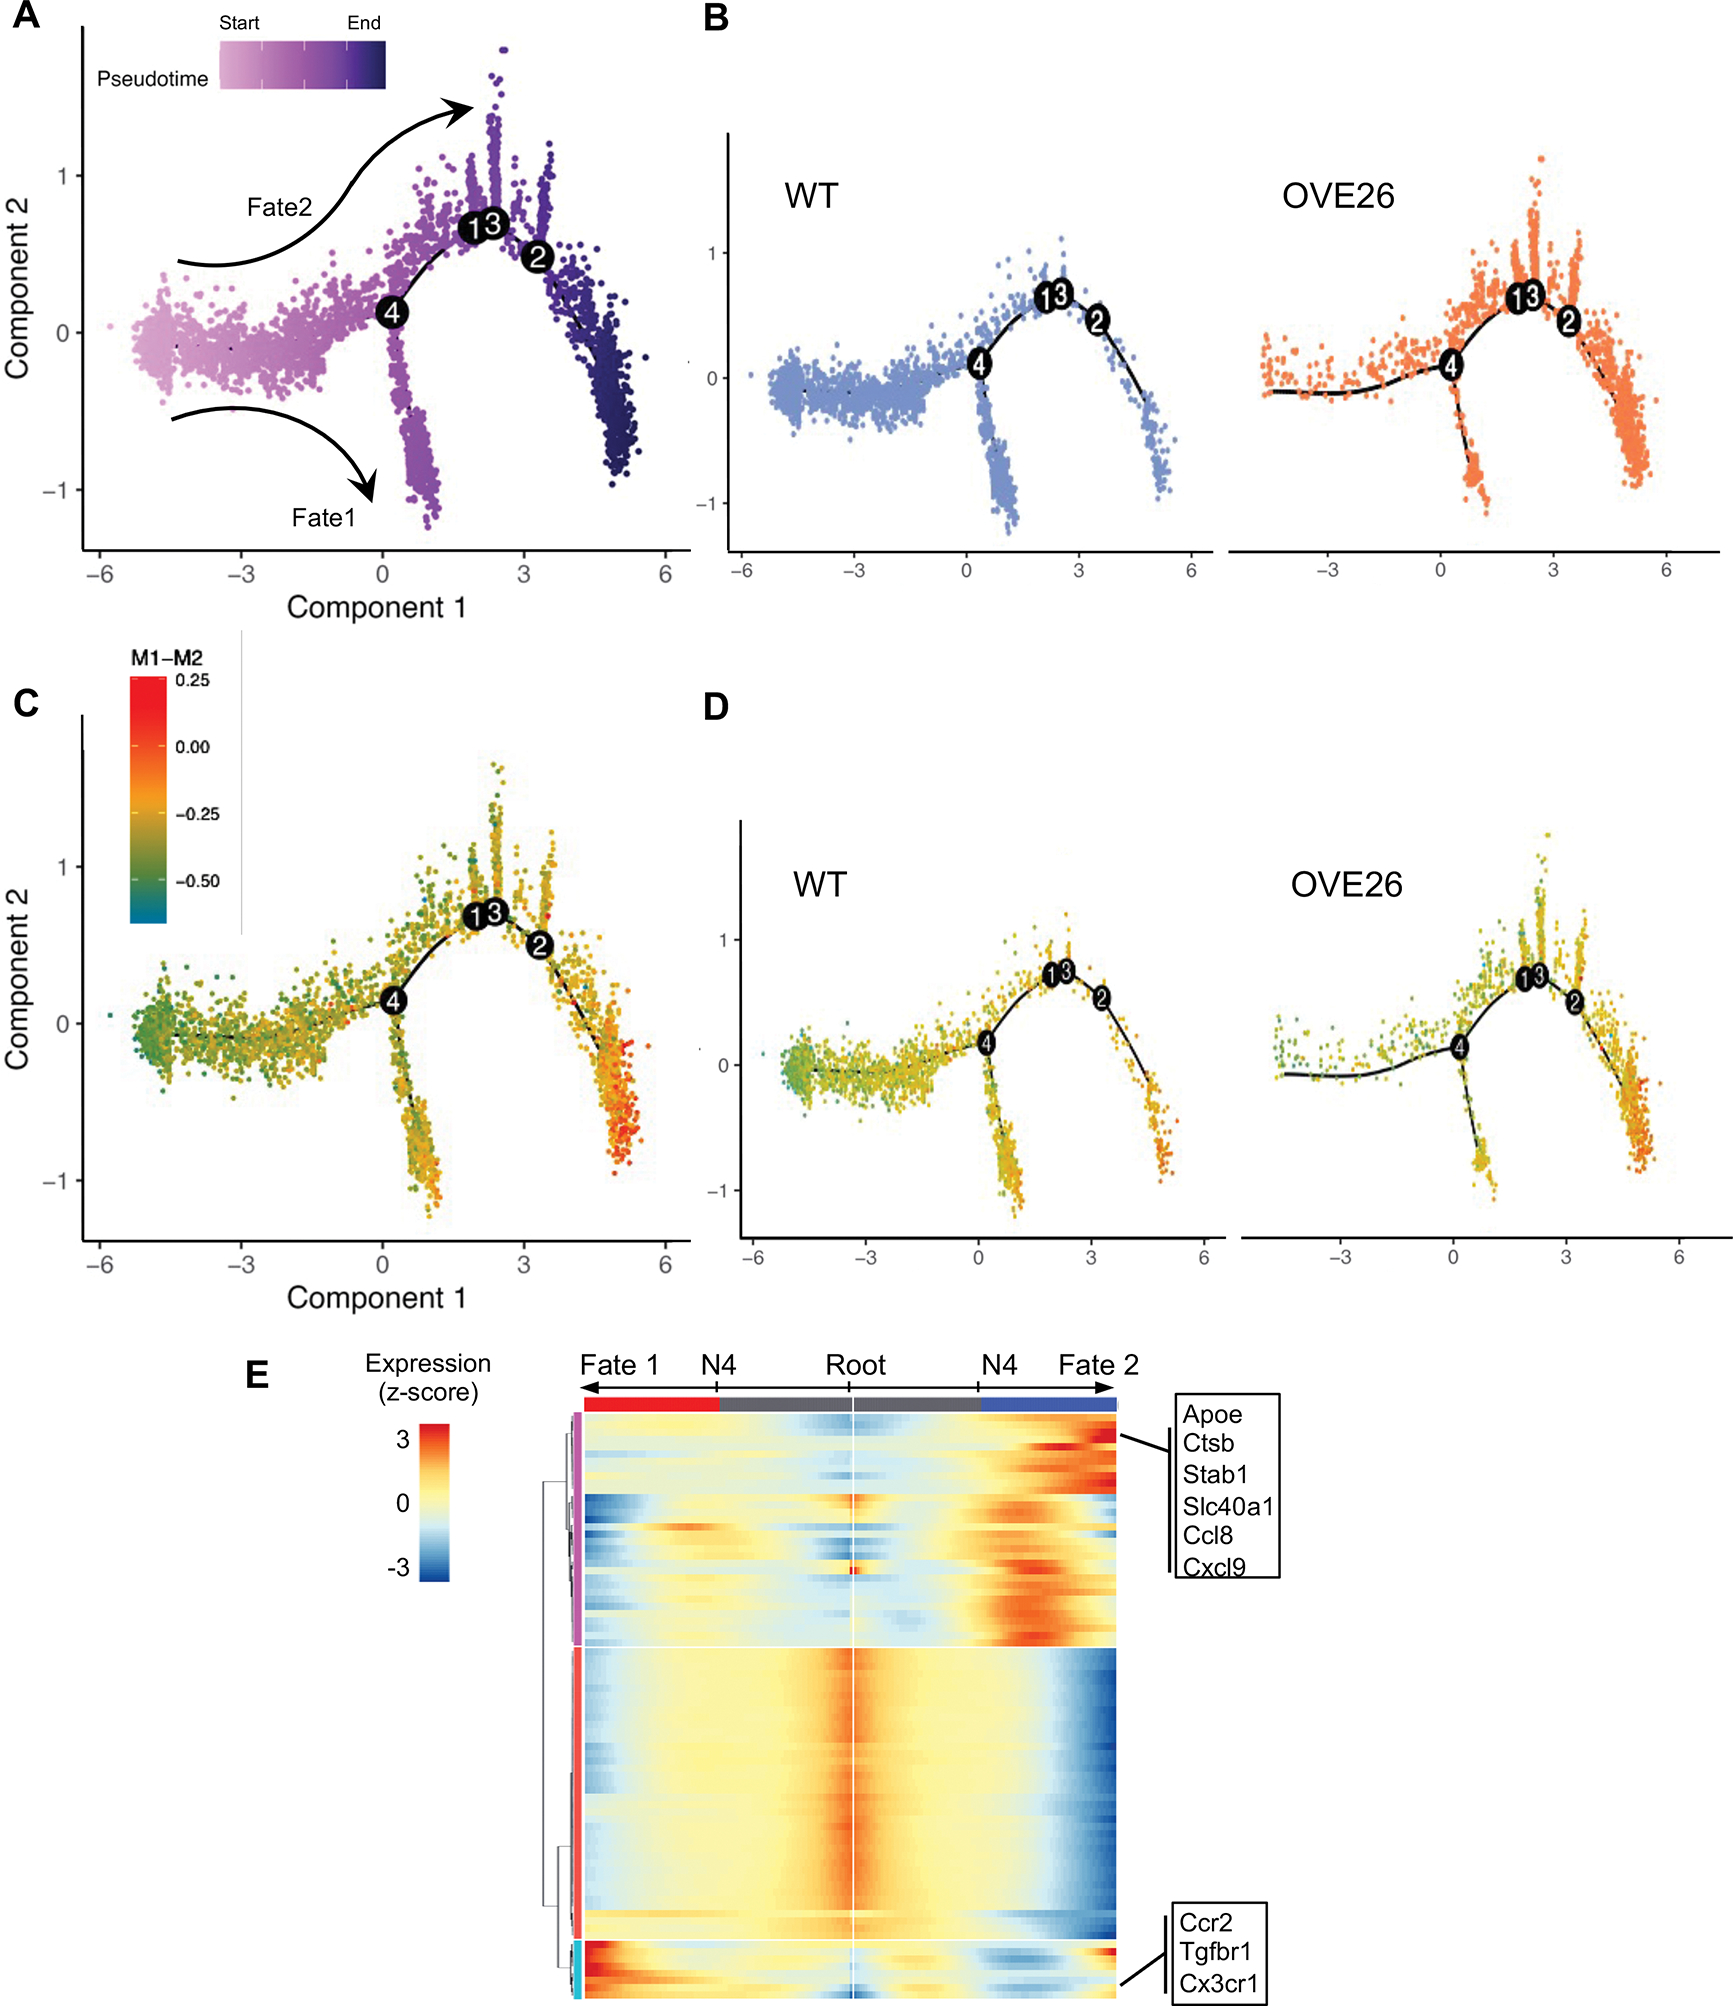
Figure 4. Pseudo-time trajectory of macrophages between control and diabetic mice.

(A) Cell trajectory tree colored by pseudo-time for all macrophages in 7-month-old WT and OVE26 kidneys identified two main cell fates, separated from branch node 4. (B) Cell trajectory tree separated by experimental groups. (C) Cell trajectory showing the relative M1-M2 score for all macrophages. (D) Cell trajectory showing the relative M1-M2 score for WT and OVE26 macrophages. (E) Heatmap of genes that are differentially expressed along the branches separated by node 4.
