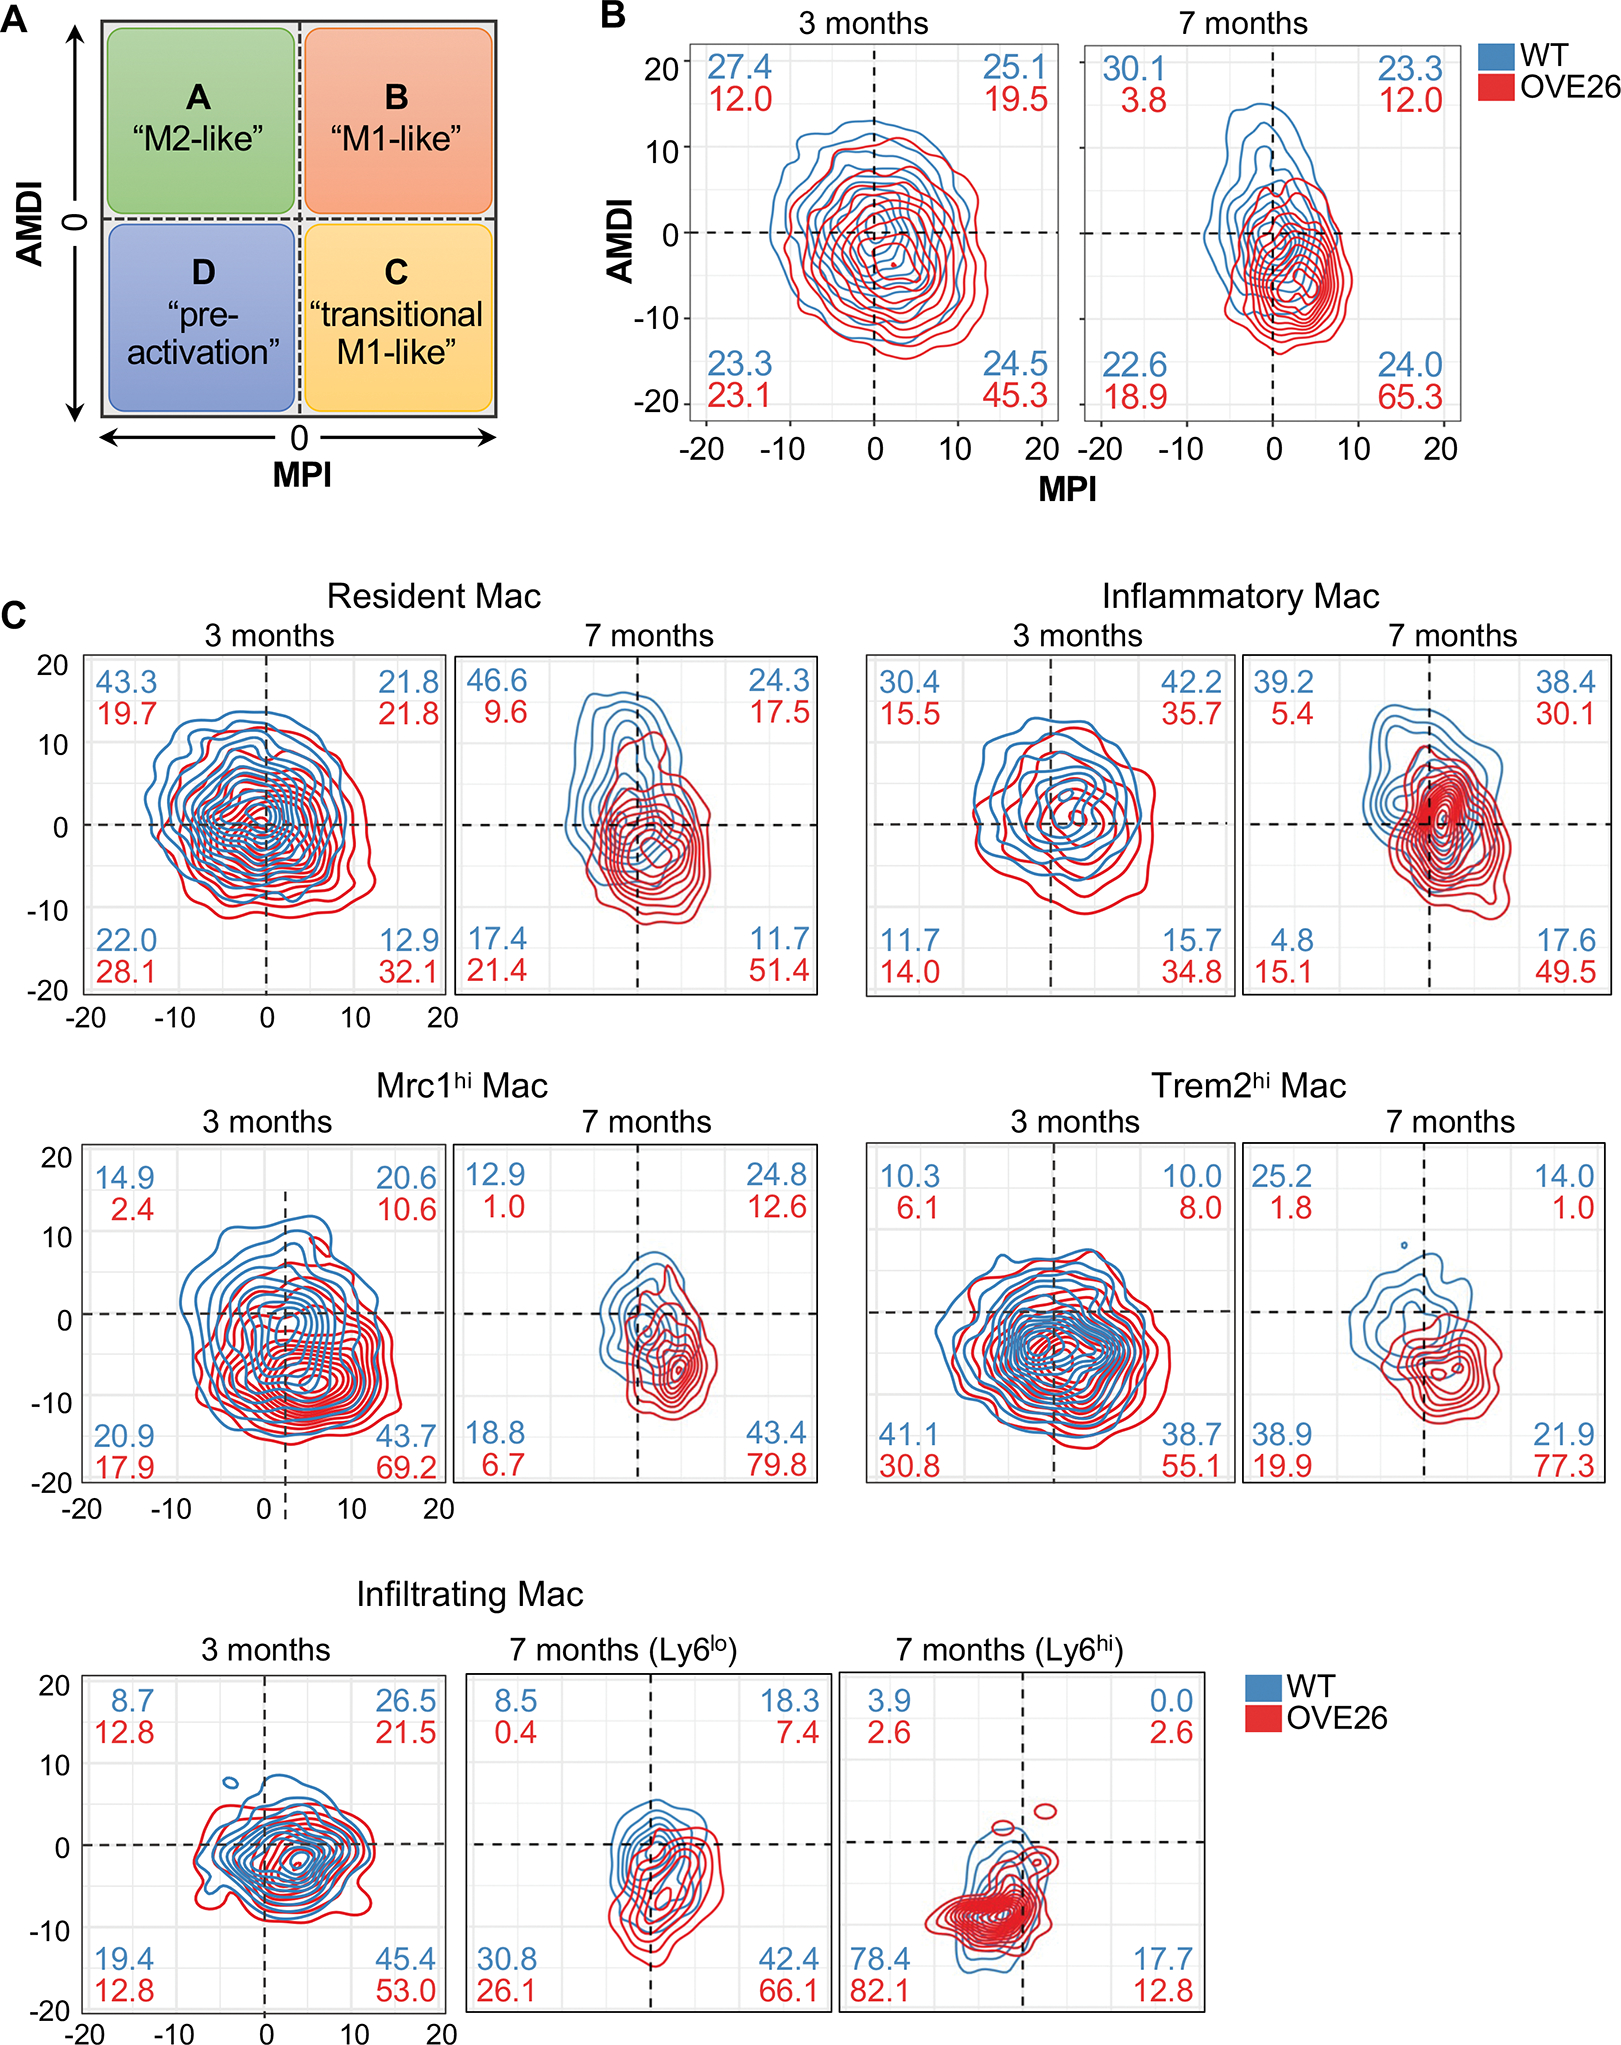
Figure 5. MacSpectrum characterization of macrophage activation in the diabetic kidney.

(A) Schematics showing the four designations of macrophages by MacSpectrum (adapted from Li C. et al., 2019). (B-C) Contour plot of all macrophages (B) and select subsets (C) in WT and OVE26 kidneys with AMDI and MPI. Percentages of macrophages in each subpopulation are shown in each quadrant for WT (blue) and OVE26 (red) macrophages.
