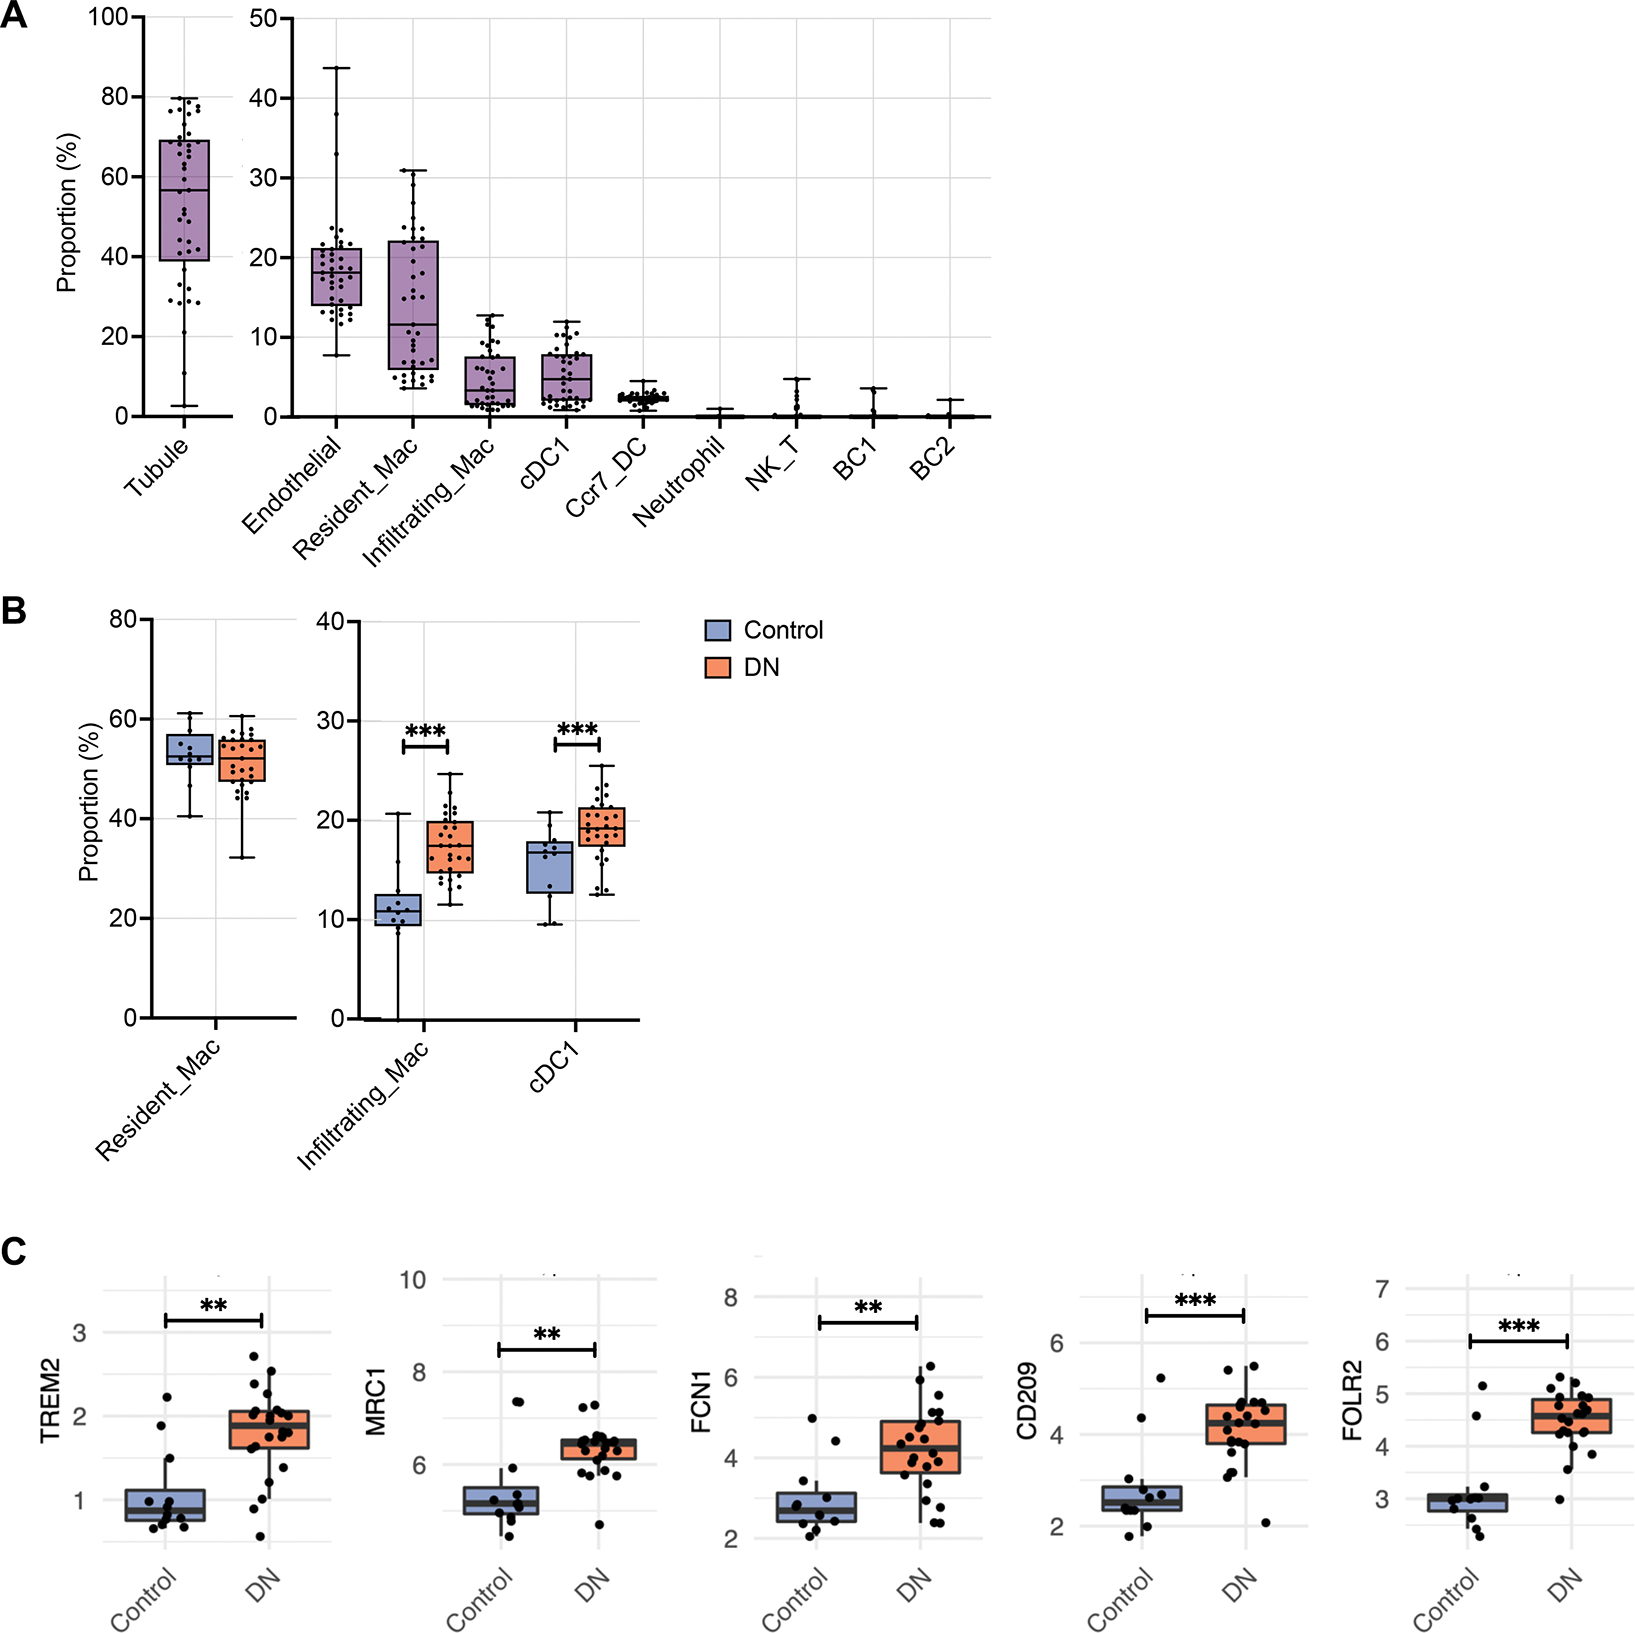
Figure 6. MNP evaluation in human DKD with deconvolution of bulk RNA-seq dataset.

(A) Box plot showing the putative proportion of each cell type relative to total kidney cells in deconvolved bulk RNA-seq samples from Fan et al. 2019 (n=12 nephrectomy controls, n=22 DKD samples). (B) Comparison of the putative proportion of MNPs relative to total immune cells in DKD and control samples. (C) Gene expression (log2 (Count per Million + 1)) of markers of each cell type between DKD and control samples. *P<0.05, **P<0.01, and ***P<0.0001 between groups by Wilcoxon rank sum test.
