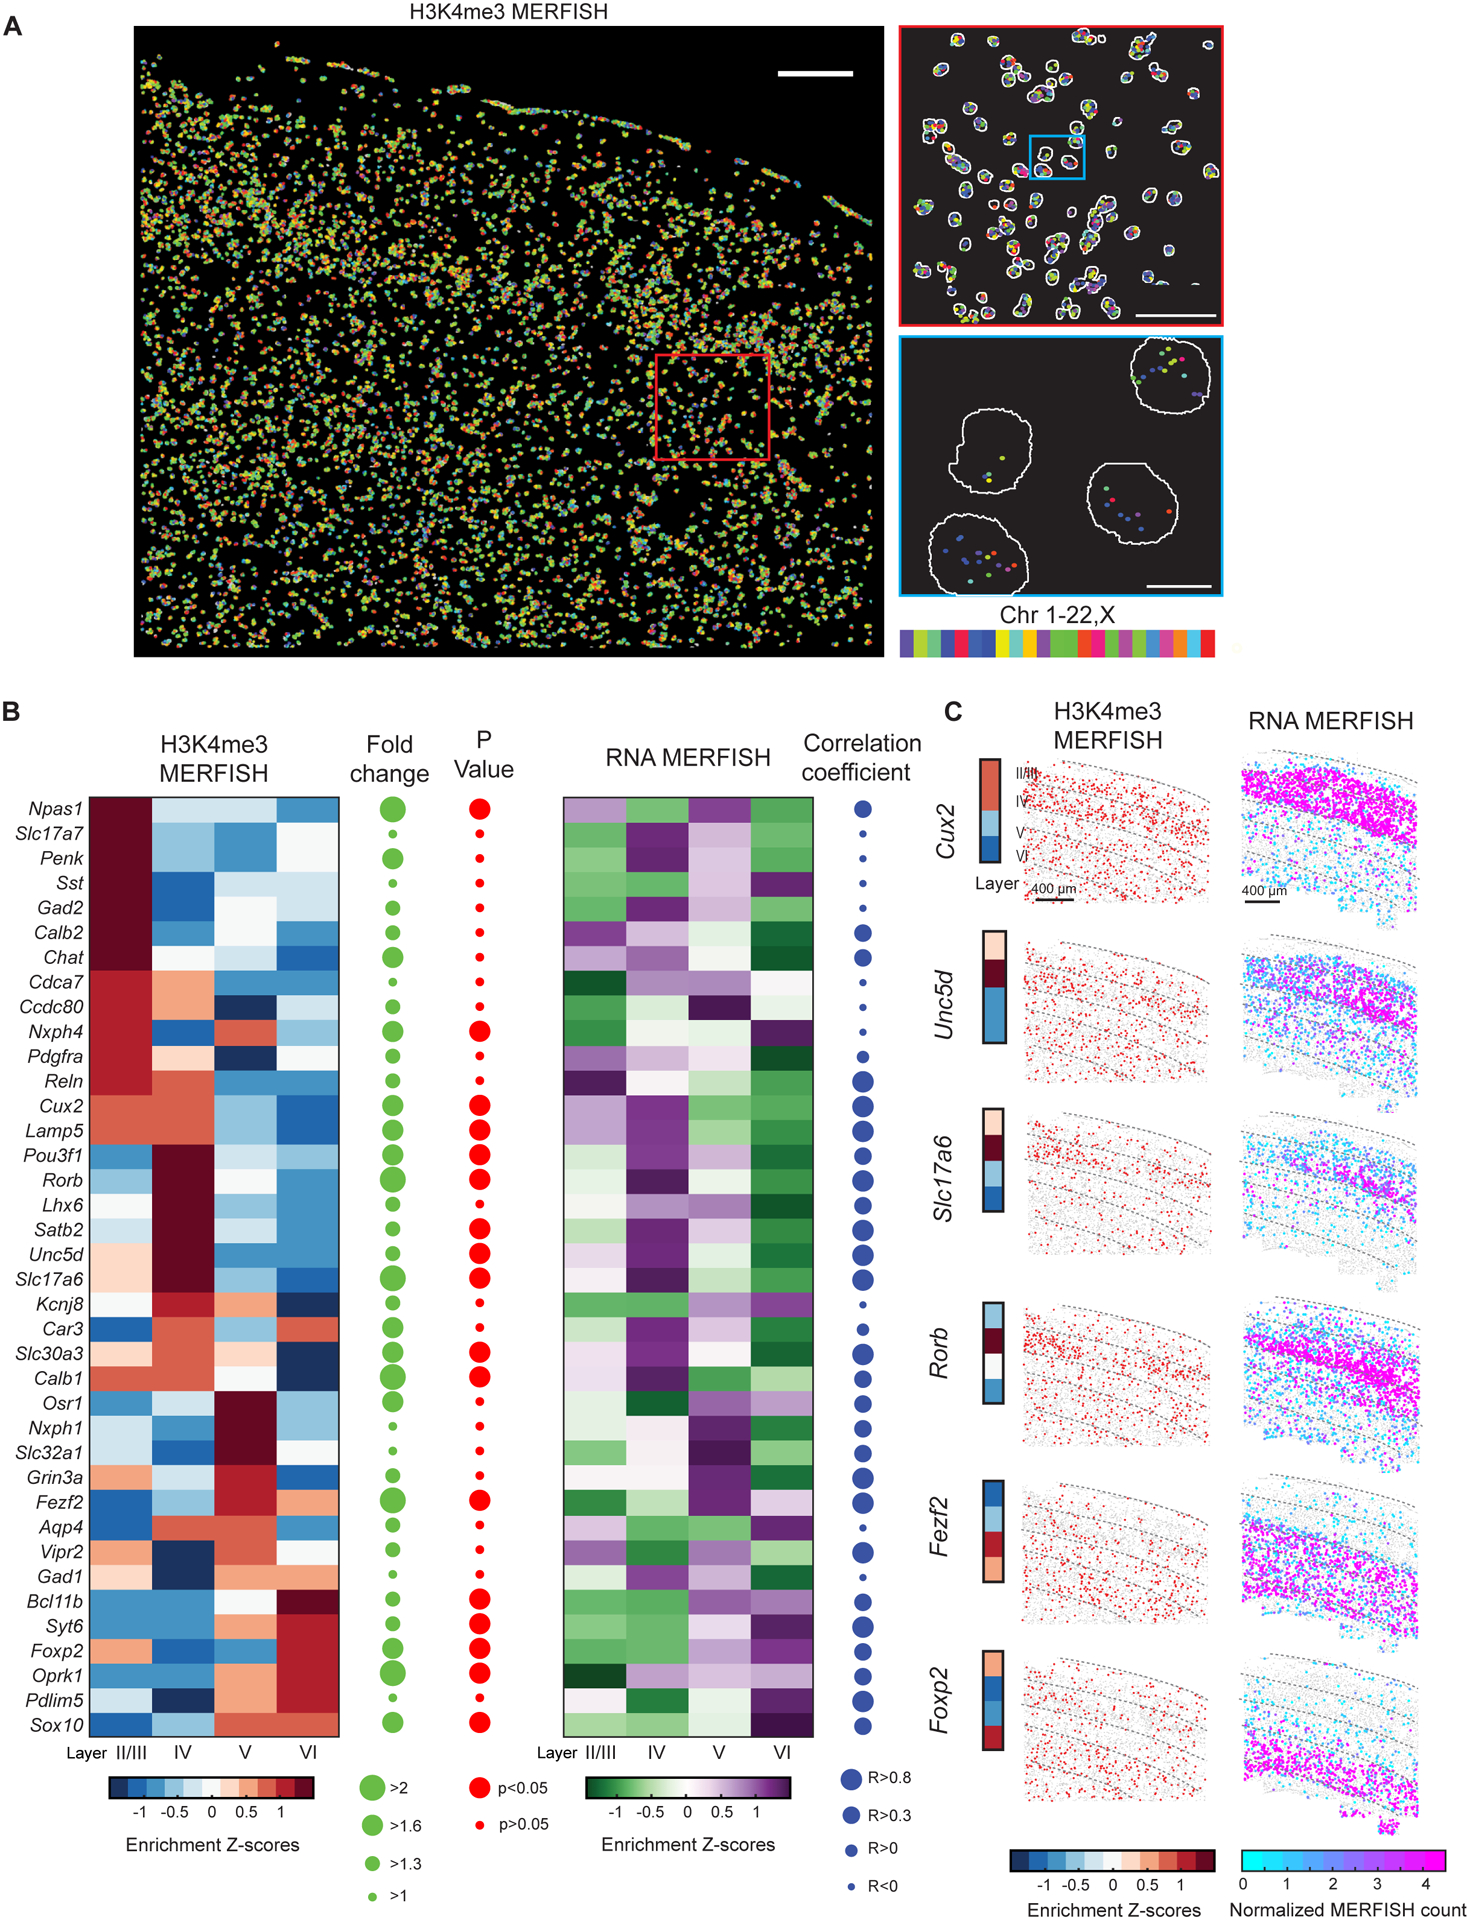
Figure 2. Spatially resolved single-cell profiling of layer-specific active promoters in adult mouse cortex.

(A) Left: Epigenomic MERFISH image of 127 target H3K4me3 loci in the somatosensory cortex region of a coronal slice of an adult mouse brain. Scale bar: 200 μm. Top right: A magnified view of the red-boxed region from the left panel. Scale bar: 75 μm. Bottom right: A magnified view of the blue-boxed region from the top right panel. Segmentation of individual nuclei are shown in white and decoded spots are color-coded by the chromosomal identities of the loci. Scale bar: 10 μm.
(B) Left: Layer enrichment z-scores for the promoter H3K4me3 signals measured by epigenomic MERFISH for the indicated genes. For each promoter locus, the enrichment in a specific layer is calculated as the z-score of the fraction of cells in the layer that is H3K4me3-positive for this locus. The fold change in the fraction of H3K4me3-positive cells between the layers with the maximum and minimum enrichment (green) and the statistical significance (p-value) of the layer-specific enrichment (red) are shown on the right. Results from replicate 1 is shown here and comparison between replicates 1 and 2 is shown in Figure S3A. Right: Layer enrichment z-scores for the RNA expression level measured by RNA MERFISH for the indicated genes (Zhang et al., 2021). For each gene, the enrichment in a specific layer is calculated as the z-score of the fraction of cells in the layer that express this gene. The Pearson correlation coefficient of layer enrichment between the epigenomic MERFISH and RNA MERFISH data is shown on the right.
(C) Left: Epigenomic MERFISH images showing layer enrichment of H3K4me3 signals for the promoters of six indicated genes. Each dot in the images represent a cell and red dots represent cells with positive H3K4me3 signals. The layer enrichment heatmap on the left is reproduced from panel (B). Right: RNA MERFISH images showing the RNA expression levels for the six indicated genes in individual cells, with each cell presented as a dot. Normalized MERFISH counts is defined as RNA counts per cell divided by the imaged volume of each cell (Zhang et al., 2021). Scale bars: 400 μm.
See also Figures S2 and S3.
