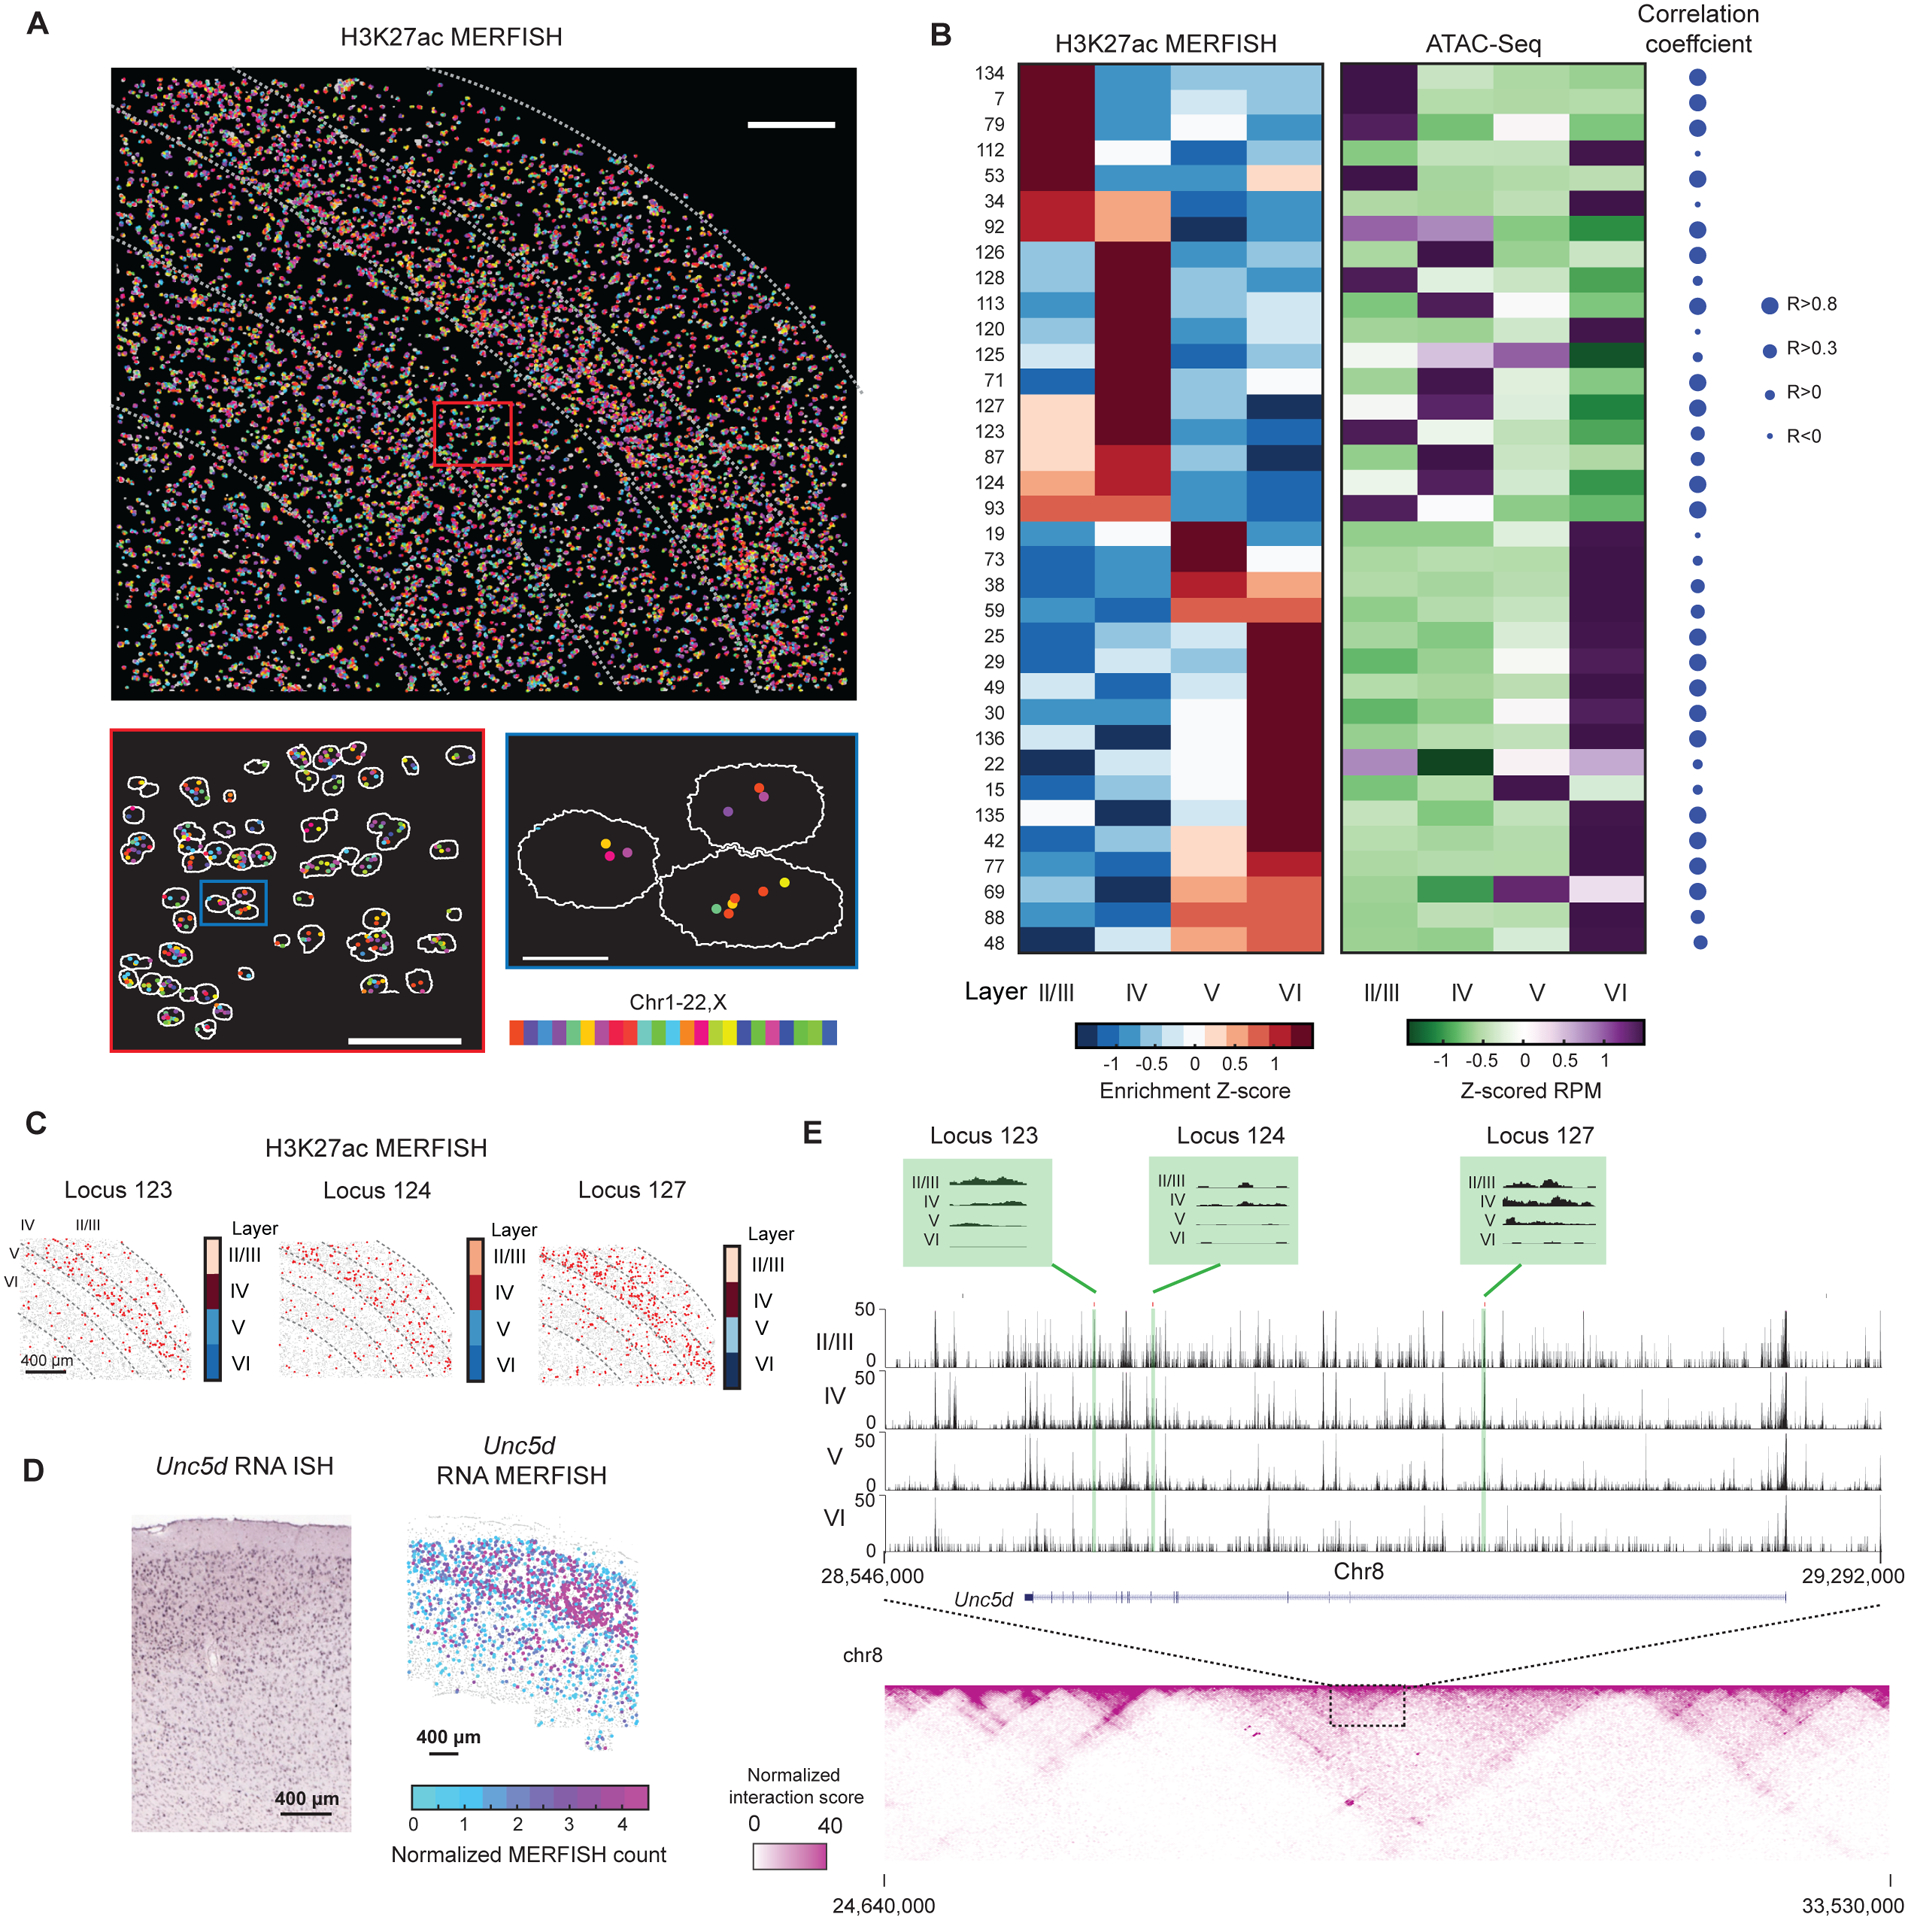
Figure 4. Spatially resolved single-cell profiling of layer-specific putative active enhancers in adult mouse cortex.

(A) Top: Epigenomic MERFISH image of 139 target H3K27ac loci in the somatosensory cortex region of a coronal slice of an adult mouse brain. Scale bar: 200 μm. Bottom left: A magnified view of the red-boxed region from the top panel. Scale bar: 75 μm. Bottom right: A magnified view of the blue-boxed region from the bottom left panel. Segmentation of individual nuclei are shown in white and decoded spots are color-coded by the chromosomal identities of the loci. Scale bar: 10 μm.
(B) Left: Layer enrichment z-scores for the H3K27ac signal measured by epigenomic MERFISH for the indicated genomic loci. Layer enrichment z-score is calculated as described in Figure 2B. Results from replicate 1 is shown and results from replicate 2 are similar. Right: The corresponding z-scored reads per million (RPM) for each of target loci from published ATAC-seq data (Gray et al., 2017). The Pearson correlation coefficients between the layer enrichment derived from epigenomic MERFISH data and ATAC seq data are shown on the right.
(C) Epigenomic MERFISH images of the H3K27ac signals for three example target loci showing enrichment in layers II/III and IV. Quantification of the layer enrichment are shown on the right (reproduced from Figure 4B). Scale bar: 400 μm.
(D) The Allen RNA ISH image (left) and RNA MERFISH image (right) of the RNA expression level of the Unc5d gene. Scale bars: 400 μm.
(E) Top: UCSC browser track of the ATAC-seq data (Gray et al., 2017) showing the location of the three target loci (loci 123, 124, 127) in the intronic regions of Unc5d. Regions marked in green are the three target loci with the green boxes above showing the enlarged version of the ATAC-seq track of the marked loci. Bottom: Hi-C map of a genomic region harboring these loci (Deng et al., 2015).
See also Figure S5.
