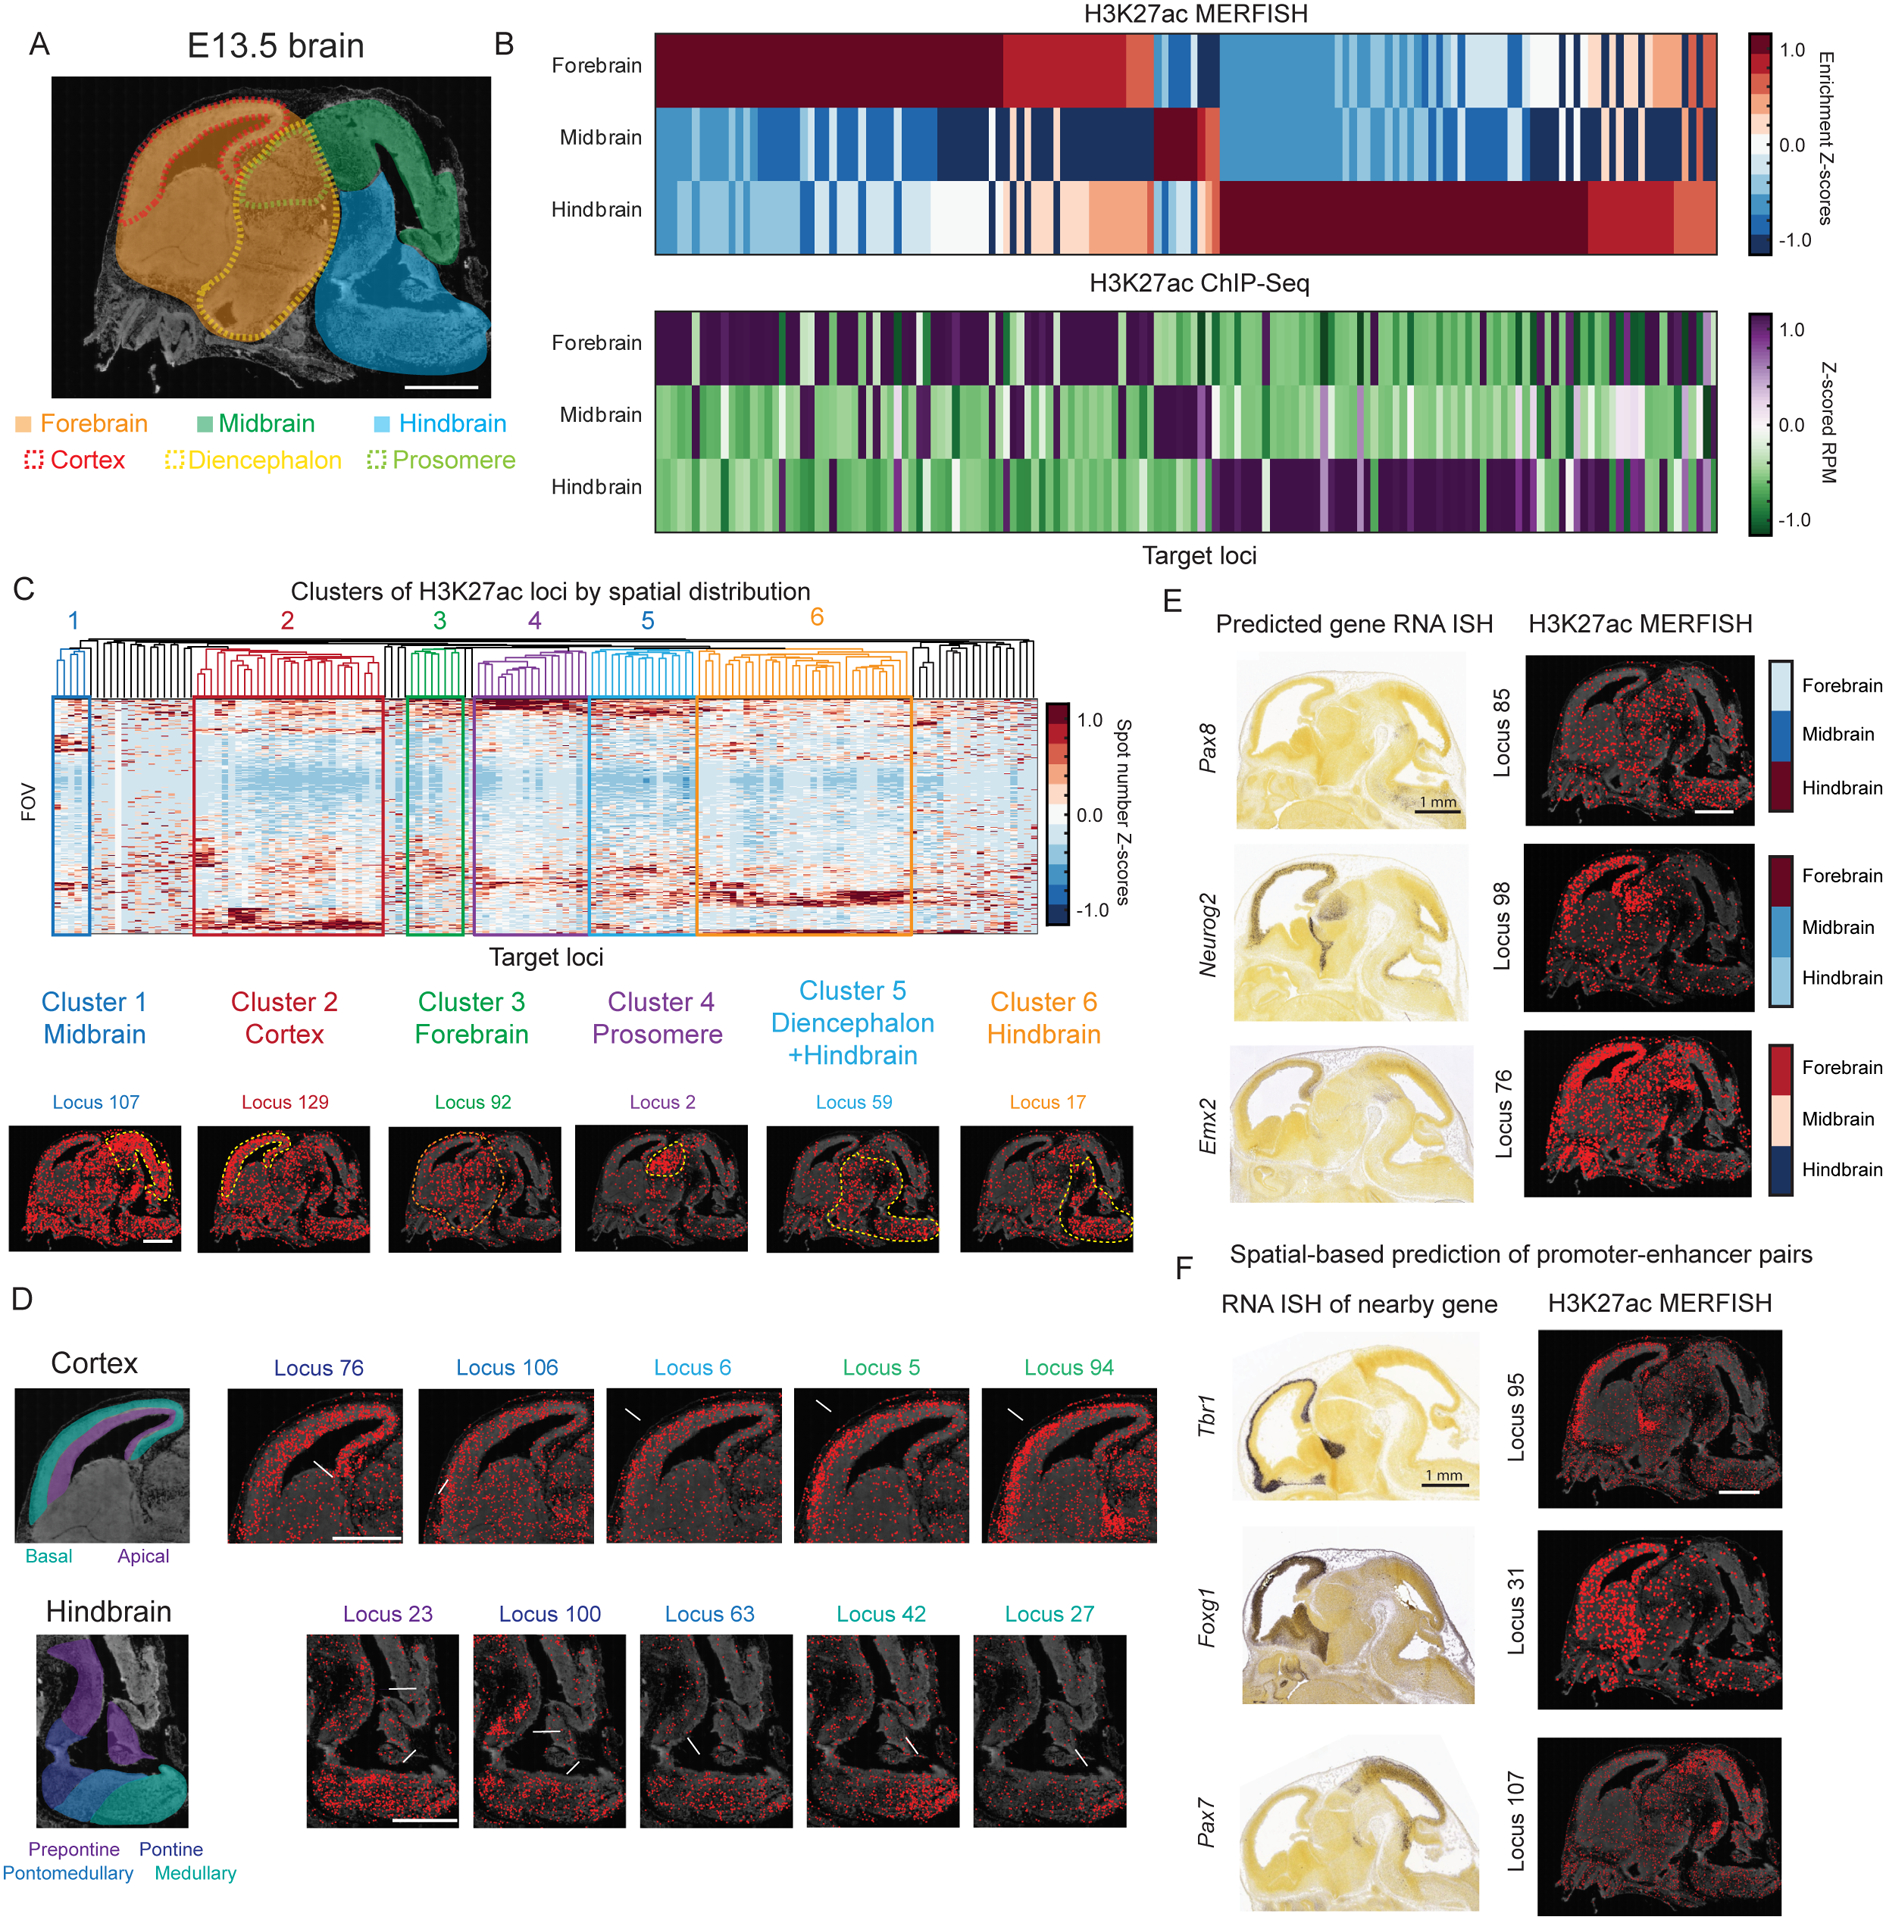
Figure 5. Spatially resolved profiling of putative active enhancers in mouse embryonic brain.

(A) Top: Schematic highlighting different brain regions (forebrain, midbrain, and hindbrain in solid color shades and cortex, diencephalon and prosomere in dotted color lines) of an imaged sagittal slice of a E13.5 mouse brain. The background shows the DAPI signal. Scale bar: 1 mm.
(B) Top: The brain region enrichment z-scores for the H3K27ac signal measured by epigenomic MERFISH for 142 target genomic loci. Brain region enrichment z-score is calculated as described in Figure 3B. Bottom: The corresponding z-scored reads per million for the target loci from published H3K27ac ChIP-seq data of the E13.5 brain (Gorkin et al., 2020).
(C) Top: Hierarchical clustering of the 142 target genomic loci based on the measured spatial distributions of the H3K27ac signals of individual loci. The spatial distribution of each locus is presented as the number of H3K27ac spots in each imaged field-of-view (FOV: 0.04 mm2) for the locus with each FOV presented as a row. Six major clusters that contains >3 loci are shown, representing six different spatial patterns (enrichment in midbrain, cortex, forebrain, prosomere, diencephalon+hindbrain, and hindbrain). Bottom: Epigenomic MERFISH images of the H3K27ac signals of six representative loci, one for each cluster. Scale bar: 1 mm.
(D) Epigenomic MERFISH images of two clusters of loci that show fine spatial distribution changes within the cortex and hindbrain. White arrows point to the region of the H3K27ac signal enrichment. Schematic shown on the left depict the regions of interest. Scale bars: 1 mm.
(E) Comparison between the spatial distributions of H3K27ac signals of three putative enhancer loci measured by epigenomic MERFISH (right) and the expression patterns of the corresponding predicted genes from the Allen RNA ISH atlas (left). Quantifications of the region-specific enrichment of the H3K27ac signals are shown on the right (reproduced from Figure 5B). Scale bars: 1 mm.
(F) Prediction of putative promoter-enhancer pairs using the H3K27ac epigenomic MERFISH data and the RNA expression pattern of the nearby genes. Epigenomic MERFISH of the H3K27ac signals of three target loci are shown on the right and Allen RNA ISH images of the corresponding nearby genes are shown on the left. Scale bars: 1 mm.
See also Figure S6.
