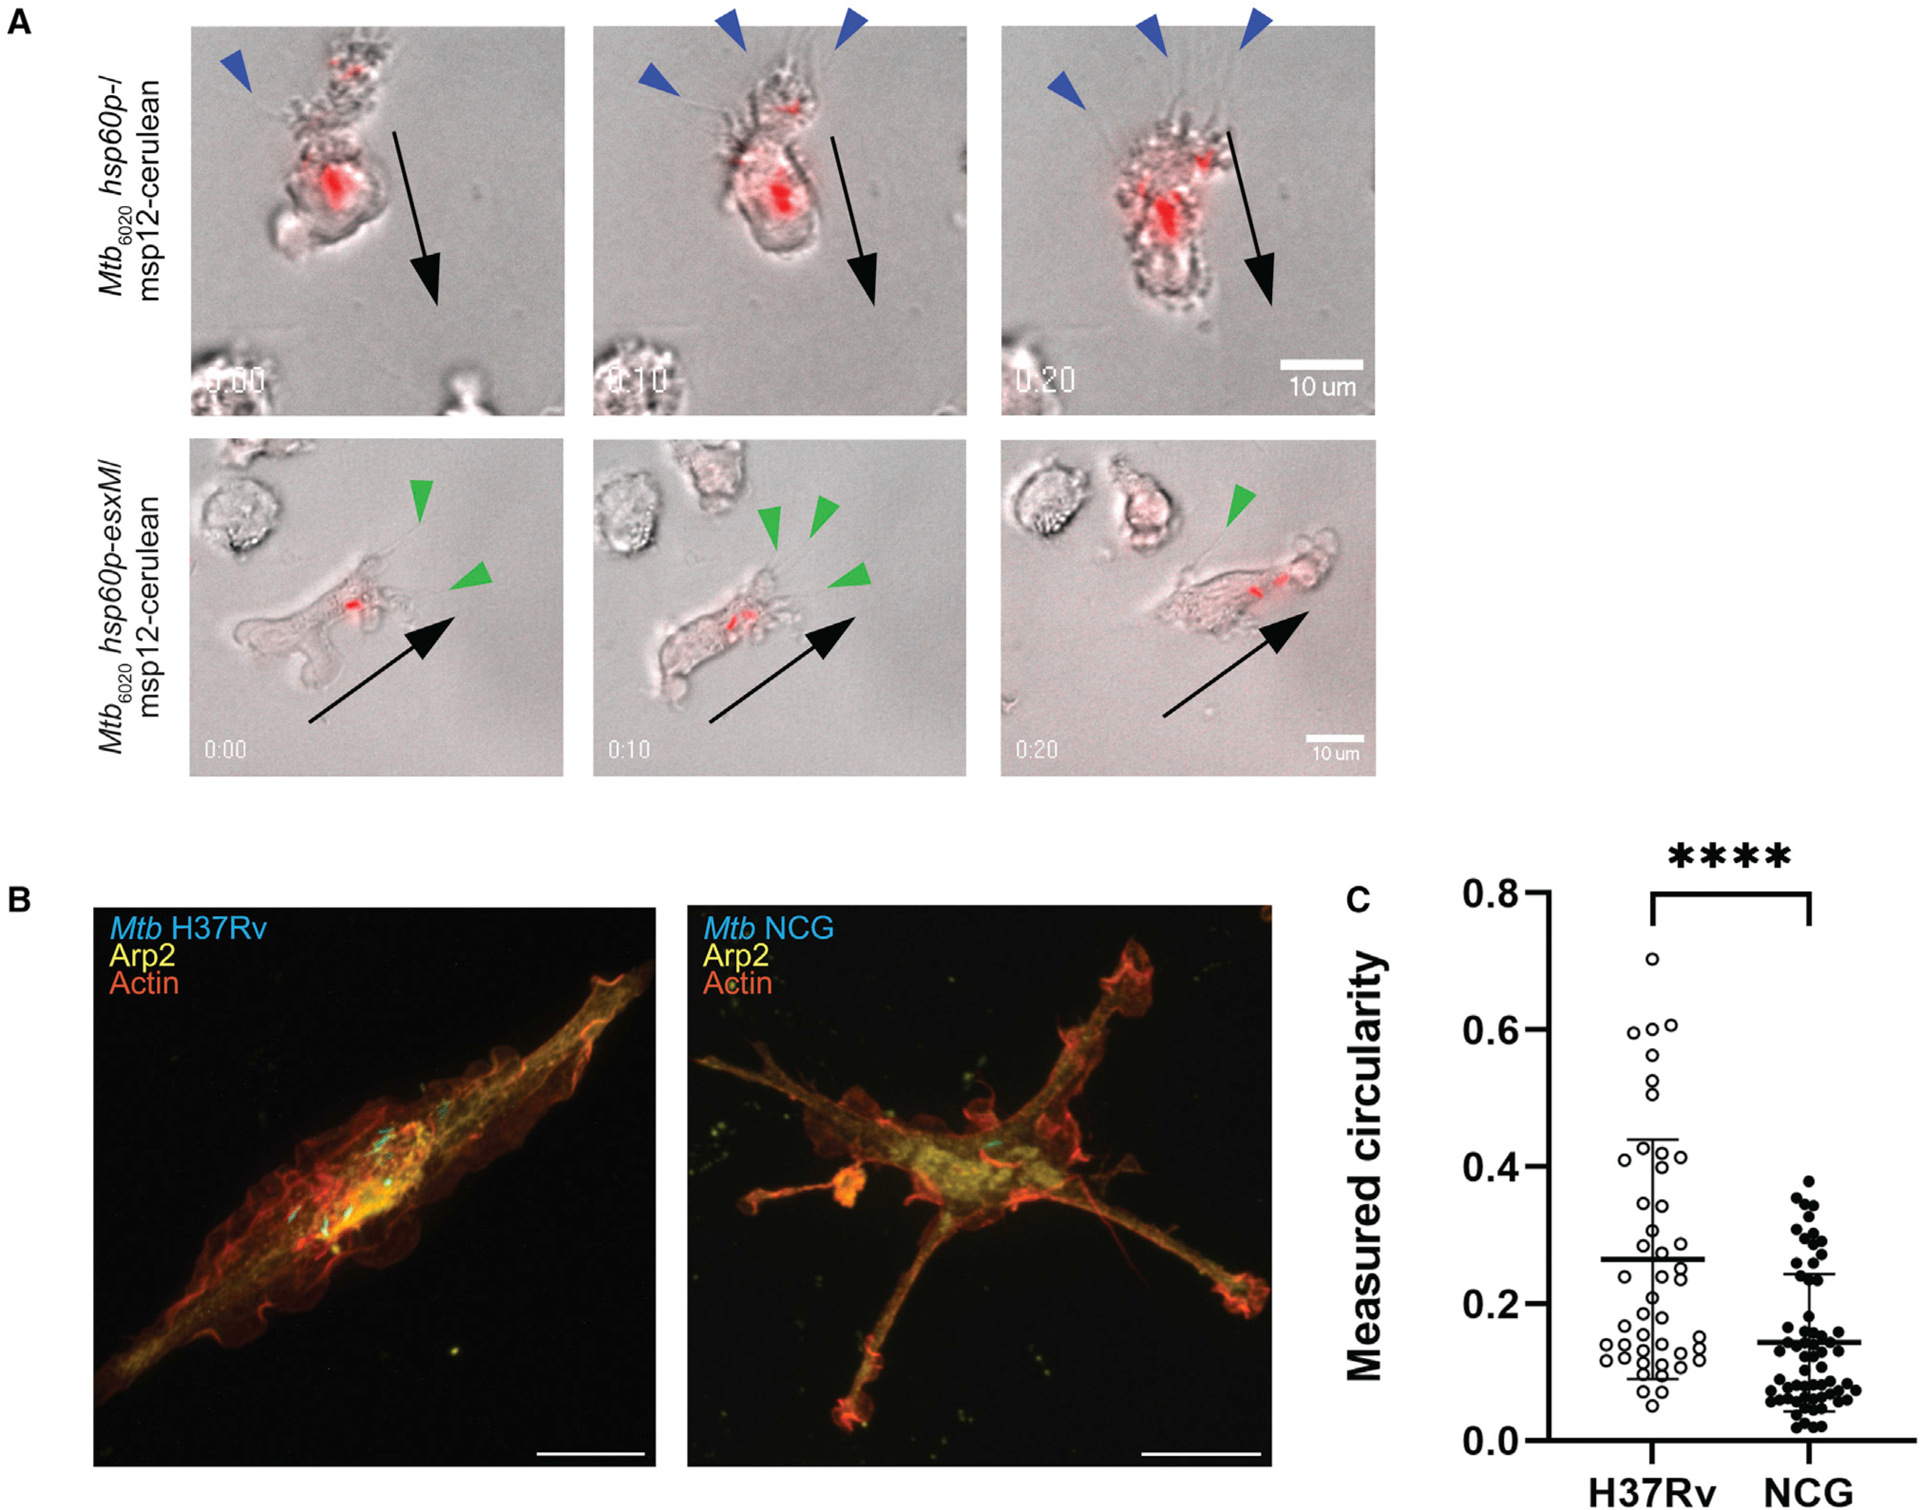
Figure 6. Altered macrophage motility and morphology during M. tuberculosis infection with full-length EsxM variants.

(A) Time-lapse imaging of BLaER1 cells infected with Mtb6020 msp12∷cerulean or Mtb6020 hsp60p∷esxM/msp12∷cerulean. Bacteria false-colored red. Spiky projections, likely retraction fibers, (blue arrowheads) localize to the lagging edge in BLaER1 cells infected with Mtb6020 msp12∷cerulean. Filopodial projections (green arrowheads) localize to the leading edge in BLaER1 cells infected with Mtb6020 hsp60p∷esxM/msp12∷cerulean. Black arrows indicate the direction of cell migration.
(B and C) Infection of BLaER1 cells with Lineage 4 (L4) Mtb H37Rv results in infected cells with membrane ruffles. Infection with the Lineage 1 (L1) Mtb NCG outbreak strain results in an increase in spiky projections and (C) a decrease in circularity, two-tailed paired Student’s t test, mean ± SD shown. ****p < 0.0001. All images representative from at least two biologically independent experiments.
See also Figures S4 and S5 and Video S4.
