Figure 10.

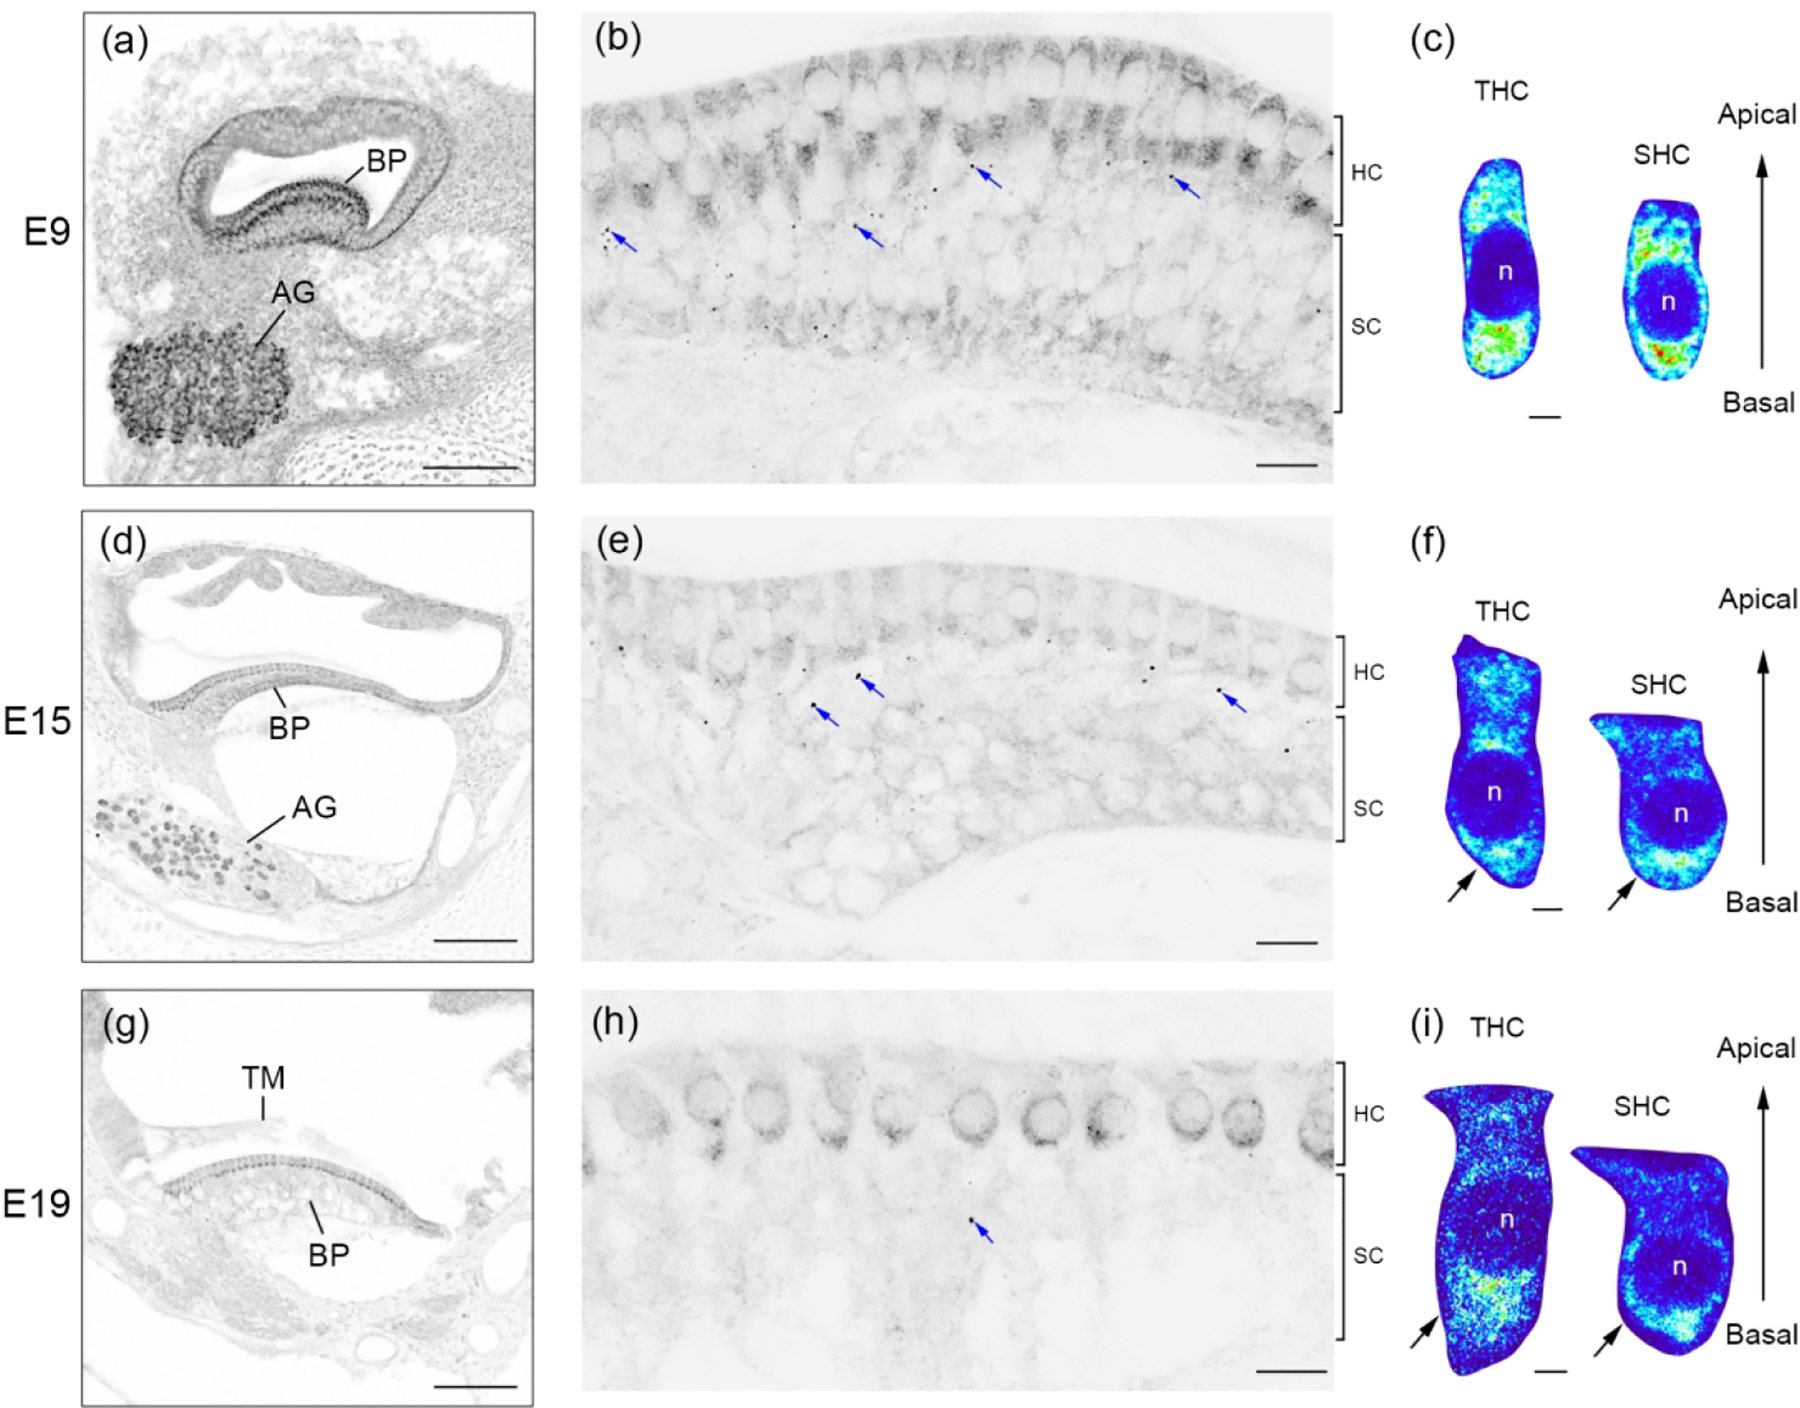
FMRP_PA8263 immunostaining in the chicken basilar papilla (BP) during development. Images were taken at E9 (a–c), E15 (d–f), and E19 (g–i). The left column (a, d, g) contains low-magnification images of the cochlea cross section. The middle column (b, e, h) contains high-magnification images of the BP. Blue arrows point to darkly labeled FMRP puncta within the supporting cell (SC) layers. Additional images of these puncta are illustrated in Figure 16. The right column (c, f, i) contains heat maps of FMRP intensity in tall hair cells (THCs) and short hair cells (SHCs). Warm and cold colors represent high and low levels of FMRP intensity, respectively. Note that the color scale is the same for THCs and SHCs of the same age. The nuclei of hair cells are labeled with “n”. Scale bars = 100 μm in a, d, g; 10 μm in b, e, h; 2 μm in c, f, i.
