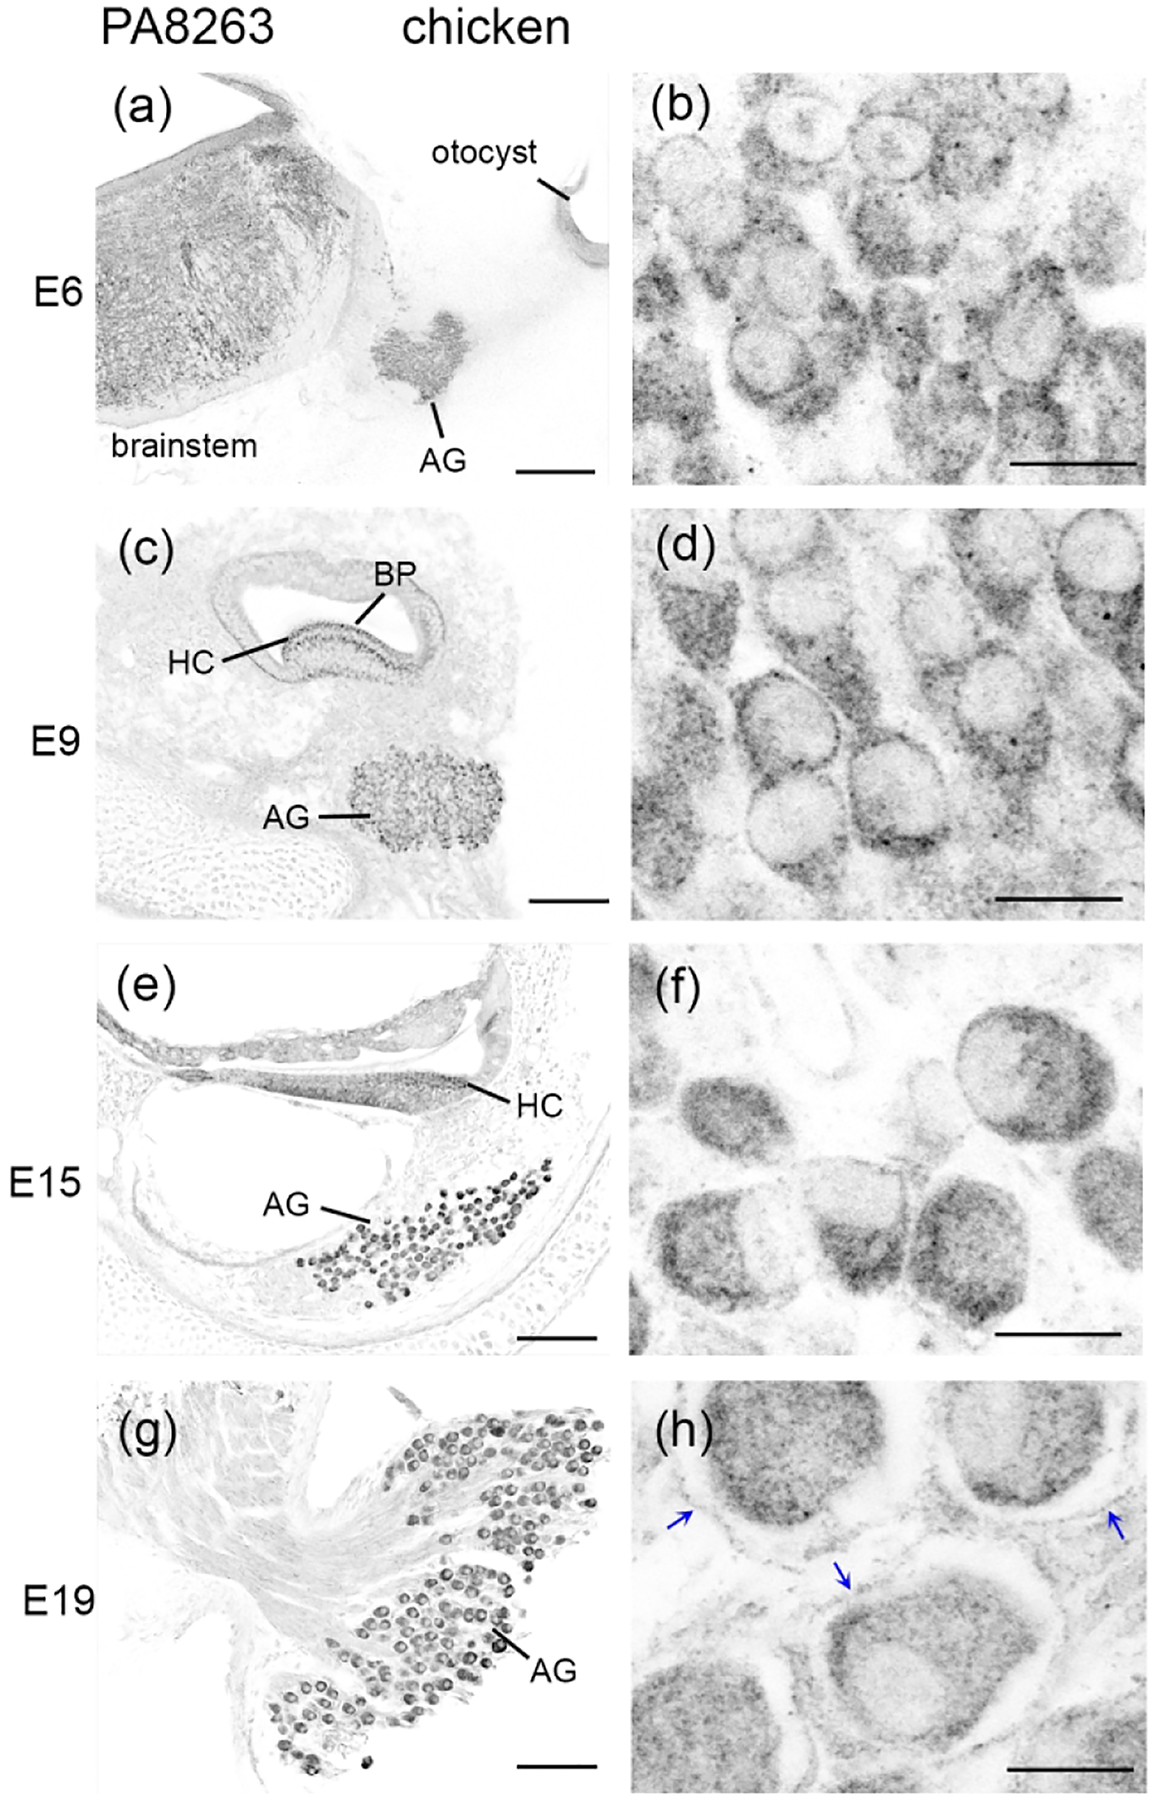
Figure 13.

FMRP_PA8263 immunostaining in the chicken auditory ganglion (AG) during development. Images were taken from E6 (a–b), E9 (c–d), E15 (e–f), and E19 (g–h) embryos. The left column (a, c, e, g) contains low-magnification images of cochlea cross sections; (a) shows head cross section at the otocyst level at E6. The right column (b, d, f, h) contains high-magnification images of the AG. Blue arrows in (h) indicate the FMRP envelope surrounding AG neurons. Scale bars = 200 μm in a; 100 μm in c, e; 50 μm in g; 10 μm in b, d, f, h.
