Figure 5.

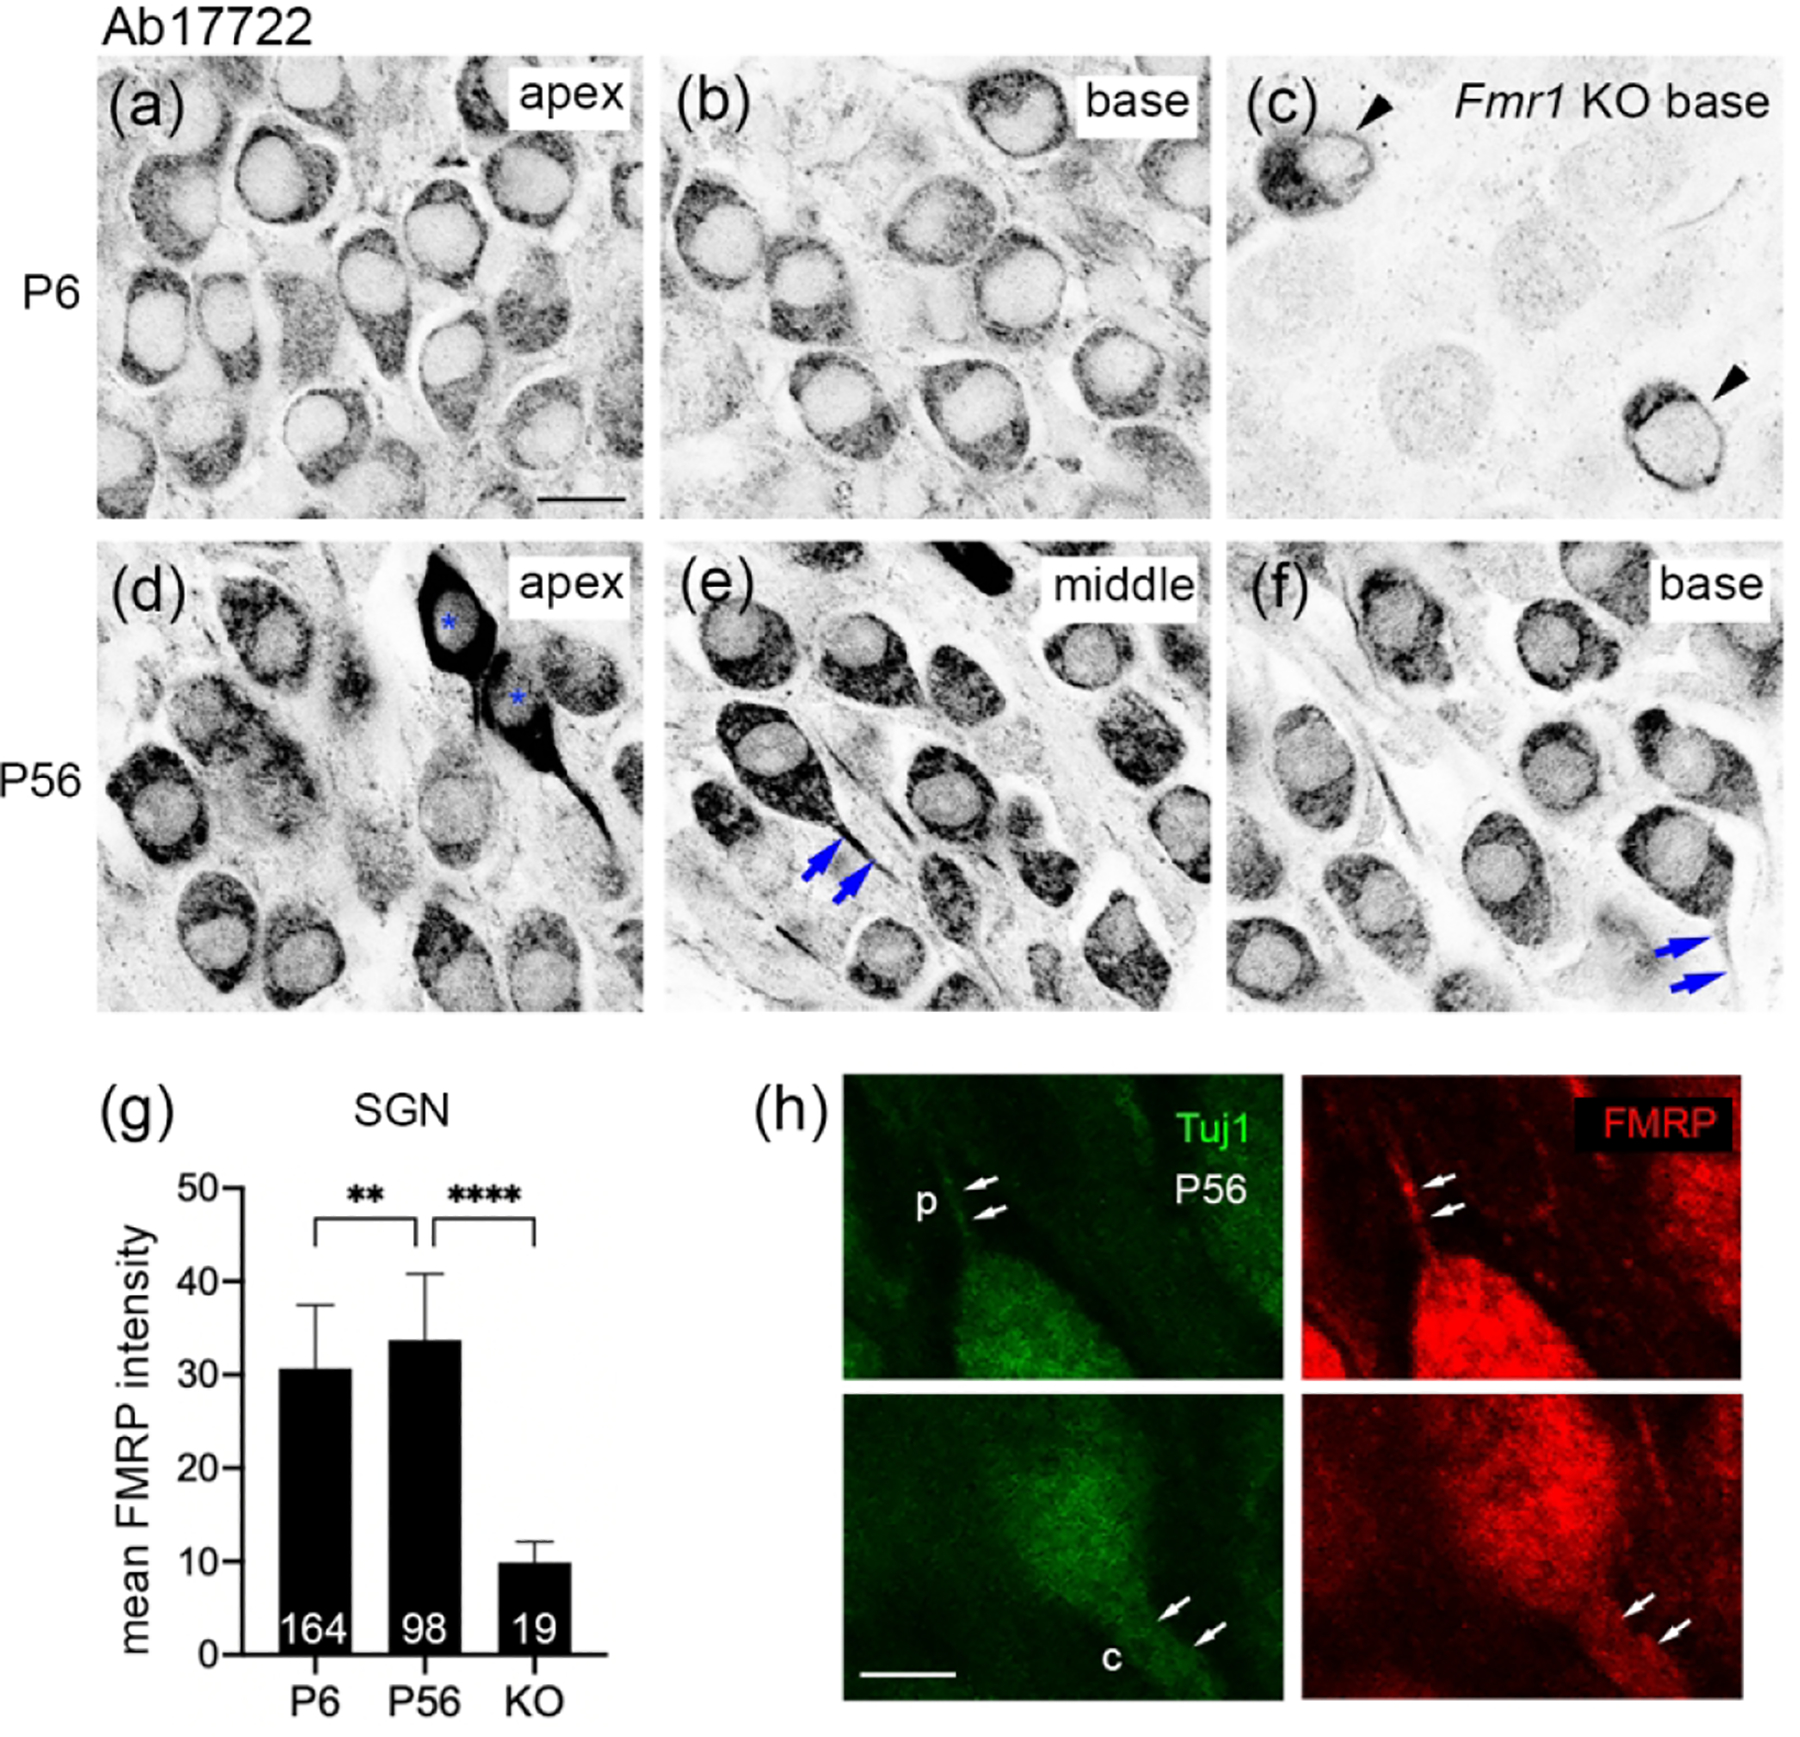
FMRP_ Ab17722 immunostaining in the mouse spiral ganglion (SG) during development. (a–c) Ab17722 immunoreactivity at P6 in the apical (a) and basal (b) portions of the WT mouse and the basal portion of the Fmr1 KO mouse (c). Arrowheads point to two neurons showing nonspecific staining. (d–f) Ab17722 immunoreactivity at P56 in the apical (d), middle (e), and basal (f) portions of the WT mouse. Asterisks label two neurons with intense Ab17722 staining in (d). Arrows point to Ab17722-labeled central axons. (g) Mean intensity of FMRP_Ab17722 in the SG neurons. The number of neurons measured in each group is indicated in the corresponding bar. Data were analyzed by one-way ANOVA followed by Tukey’s multiple comparisons: F (2, 278) = 101.5; p < 0.0001. **p<0.01; ****p<0.0001. (h) FMRP immunostaining in the processes of SG neurons. Single focal plane of confocal image of double immunostaining of FMRP-Ab17722 and Tuj1 in the SG of a P56 WT mouse. Arrows point to the peripheral (p) and central (c) processes of a SG neuron. Scale bars = 10 μm in a, applies to a–f; 5 μm in h.
