Figure 6.

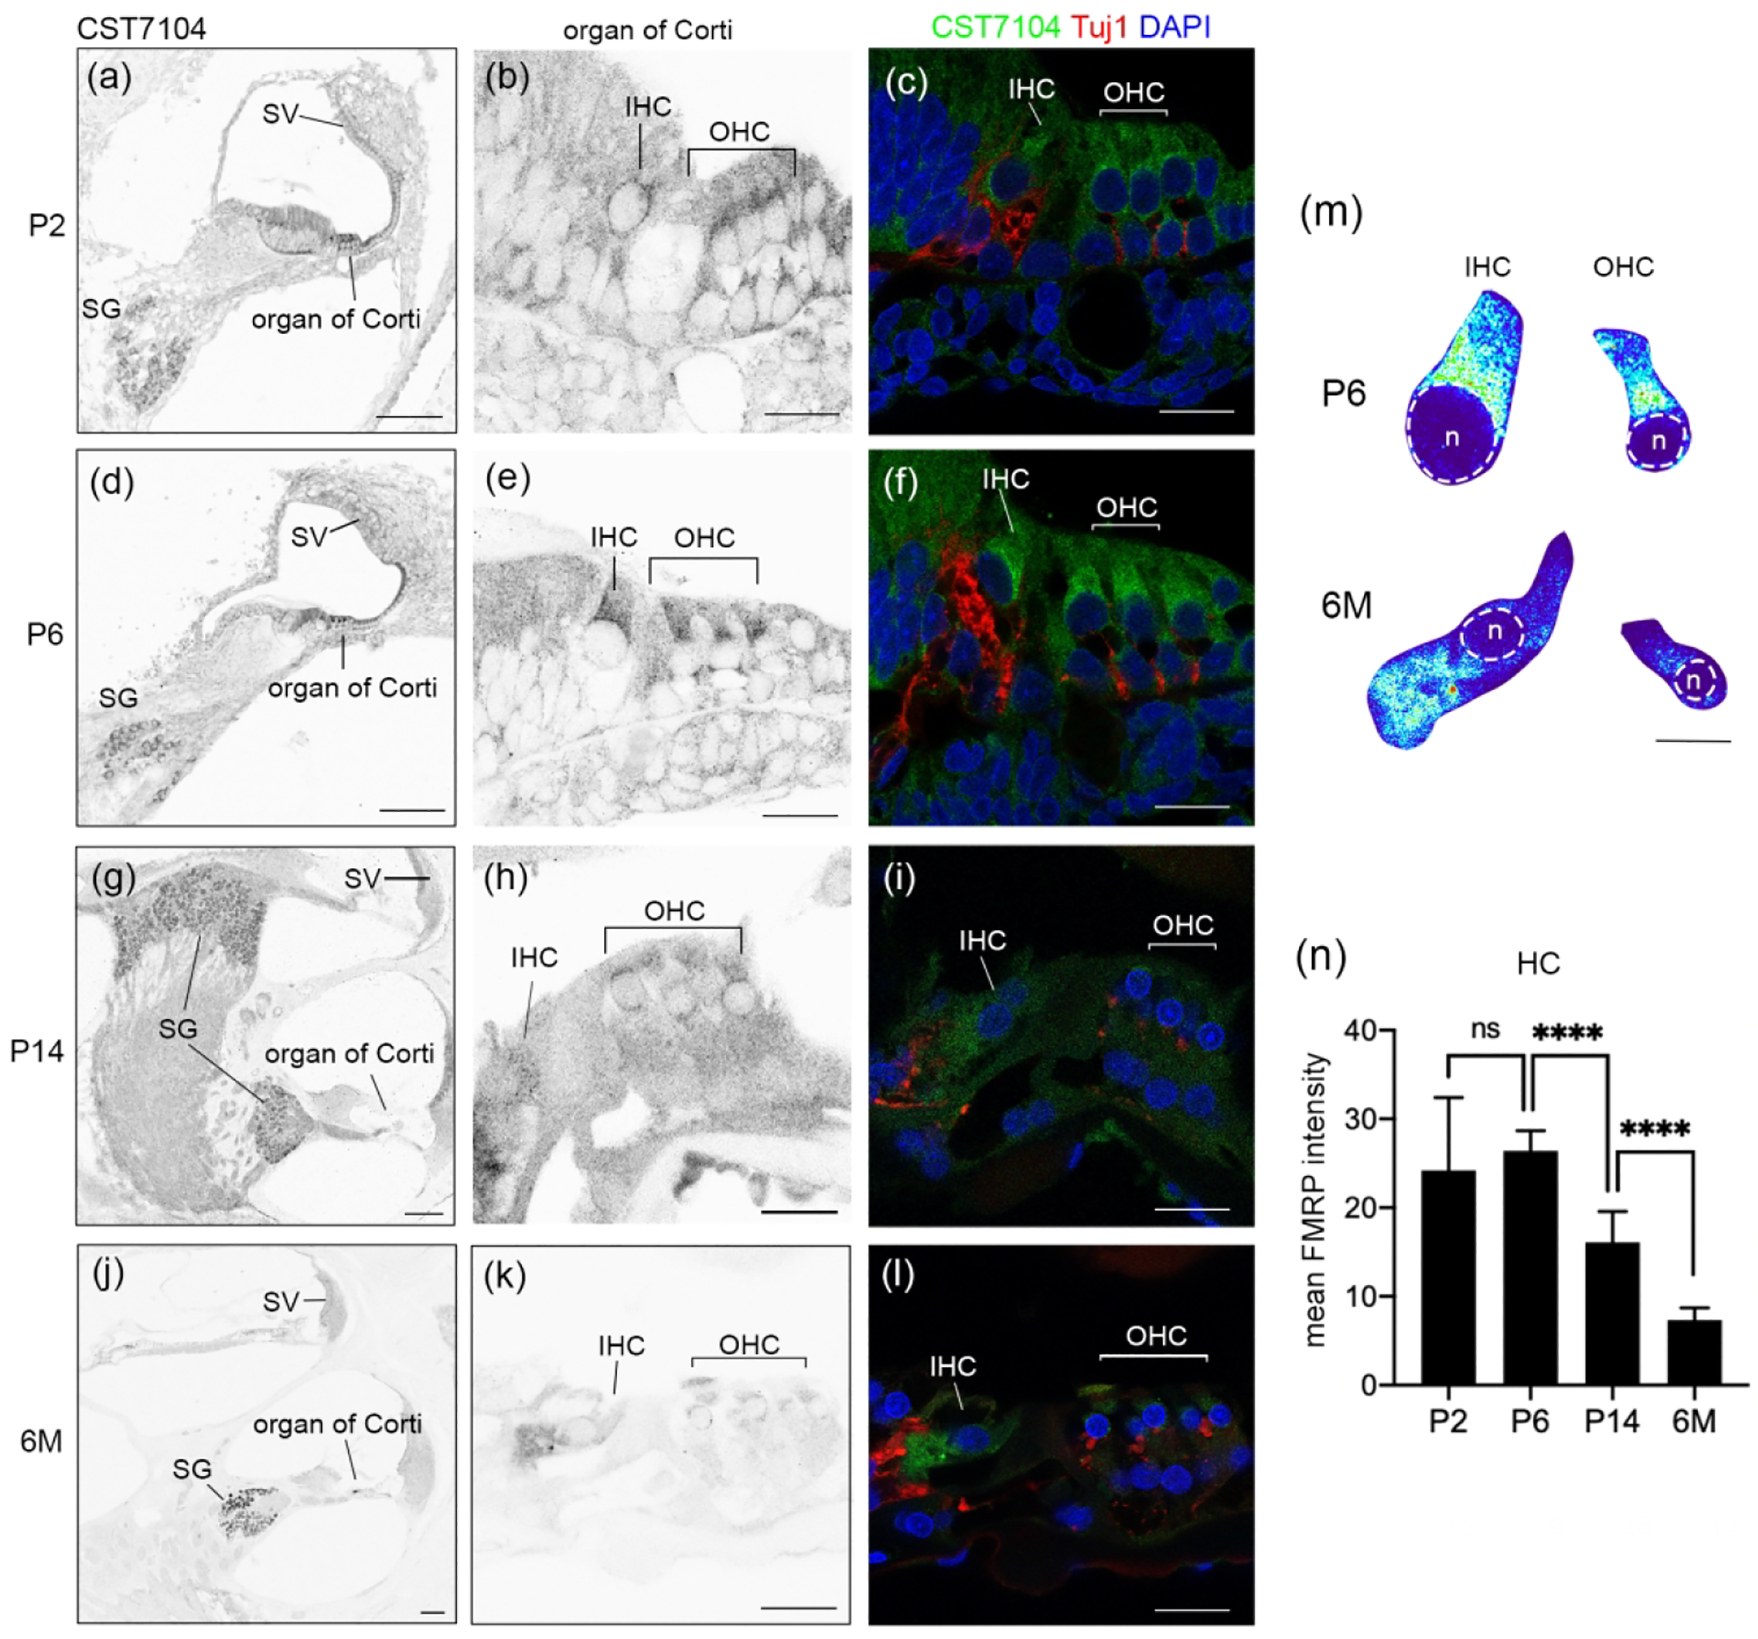
FMRP in the rat cochlea during development. (a–l) FMRP-CST7104 immunoreactivity on the cochlear cross section at P2 (a–c), P6 (d–f), P14 (g–i), and 6 months (j–l). The left column (a, d, g, j) contains low-magnification images of the FMRP channel. The middle column (b, e, h, k) contains high-magnification images of the FMRP channel in the organ of Corti. The right column (c, f, I, l) contains the triple labeling of FMRP (green), Tuj1 (red), and DAPI (blue). (m) Heatmaps of FMRP intensity in inner hair cells (IHCs) and outer hair cells (OHCs) at P6 (upper) and 6M (lower), respectively. Warmer colors represent higher intensities of FMRP immunoreactivity than colder colors. At each age, the same color scale was applied to IHCs and OHCs. The nuclei of hair cells are outlined with dashed circles and labeled with “n”. (n) Mean intensity of FMRP_CST7104 in the hair cells. The number of hair cells measured in each group is indicated in the corresponding bar. Data were analyzed by one-way ANOVA followed by Tukey’s multiple comparisons: F (3, 67) = 51.37; p < 0.0001. ****p<0.0001; ns, no significance. Scale bars = 100 μm in the left column (a, d, g, j); 20 μm in the middle and right columns (b–c, e–f, h–I, k–l); and 10 μm in m.
