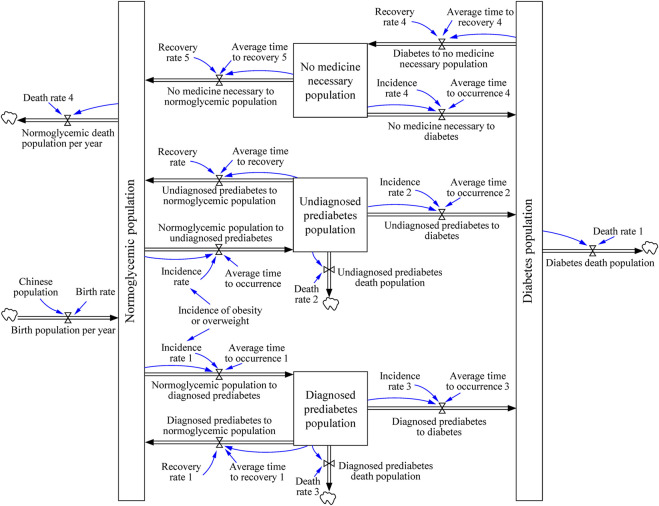
FIGURE 2.
The journey of patient with diabetes. (System dynamic model simulates the growth trend of diabetes mellitus, China. 2020–2050). Boxes are stocks that accumulate over time, and double arrows are in- or outflows that either provide input or take the output of stocks. The blue arrows indicate the links between cause and effect. Clouds are outputs that “flow out of the system” like death. The system contains the differential equations described in the “Building the DM Model” section.

