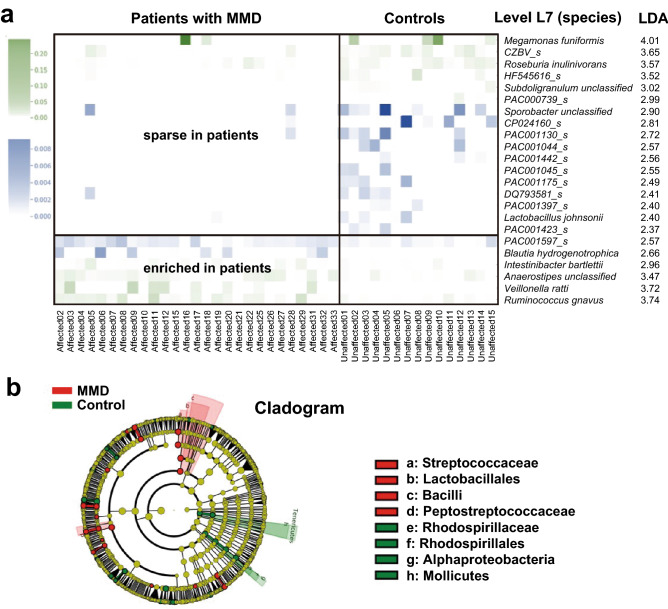
Figure 2.
Relative abundance analysis of gut microbiota. (a) The LEfSe analysis showed several microbial taxa that were significantly different between patients with MMD and control individuals. The discriminative taxa with top ranked LDA scores at the species level (L7) are shown. Heatmap demonstrates distinct patterns between patients with MMD and controls. Blue represents microbes with lower relative abundance (mostly < 0.001 as shown in the scale bar in the left panel), and green represents microbes with relative abundance higher than the blue ones. (b) The cladogram of the discriminative taxa identified by LEfSe was shown. Streptococcus of the Firmicutes Bacilli class, and Lactobacillales were enriched in patients with MMD as compared with controls, whereas Alphaproteobacteria of the Proteobacteria division, Rhodospirillaceae, and Mollicutes were enriched in controls.

